Sales Per Hour Report

@kendash
Thank you so much.
I like it to be Exactly the same if possible.
Also will it work on v4? Or only on v5?

You can use SQL in either version. I am pretty sure @gerlandog has put sample report showing Tickets Per Hour with sales.

I serched but could not find any

Was this the one? Is by gerlandog…

Thats it, you can customize that one to do what you want it shows the gist of how to build the sql.

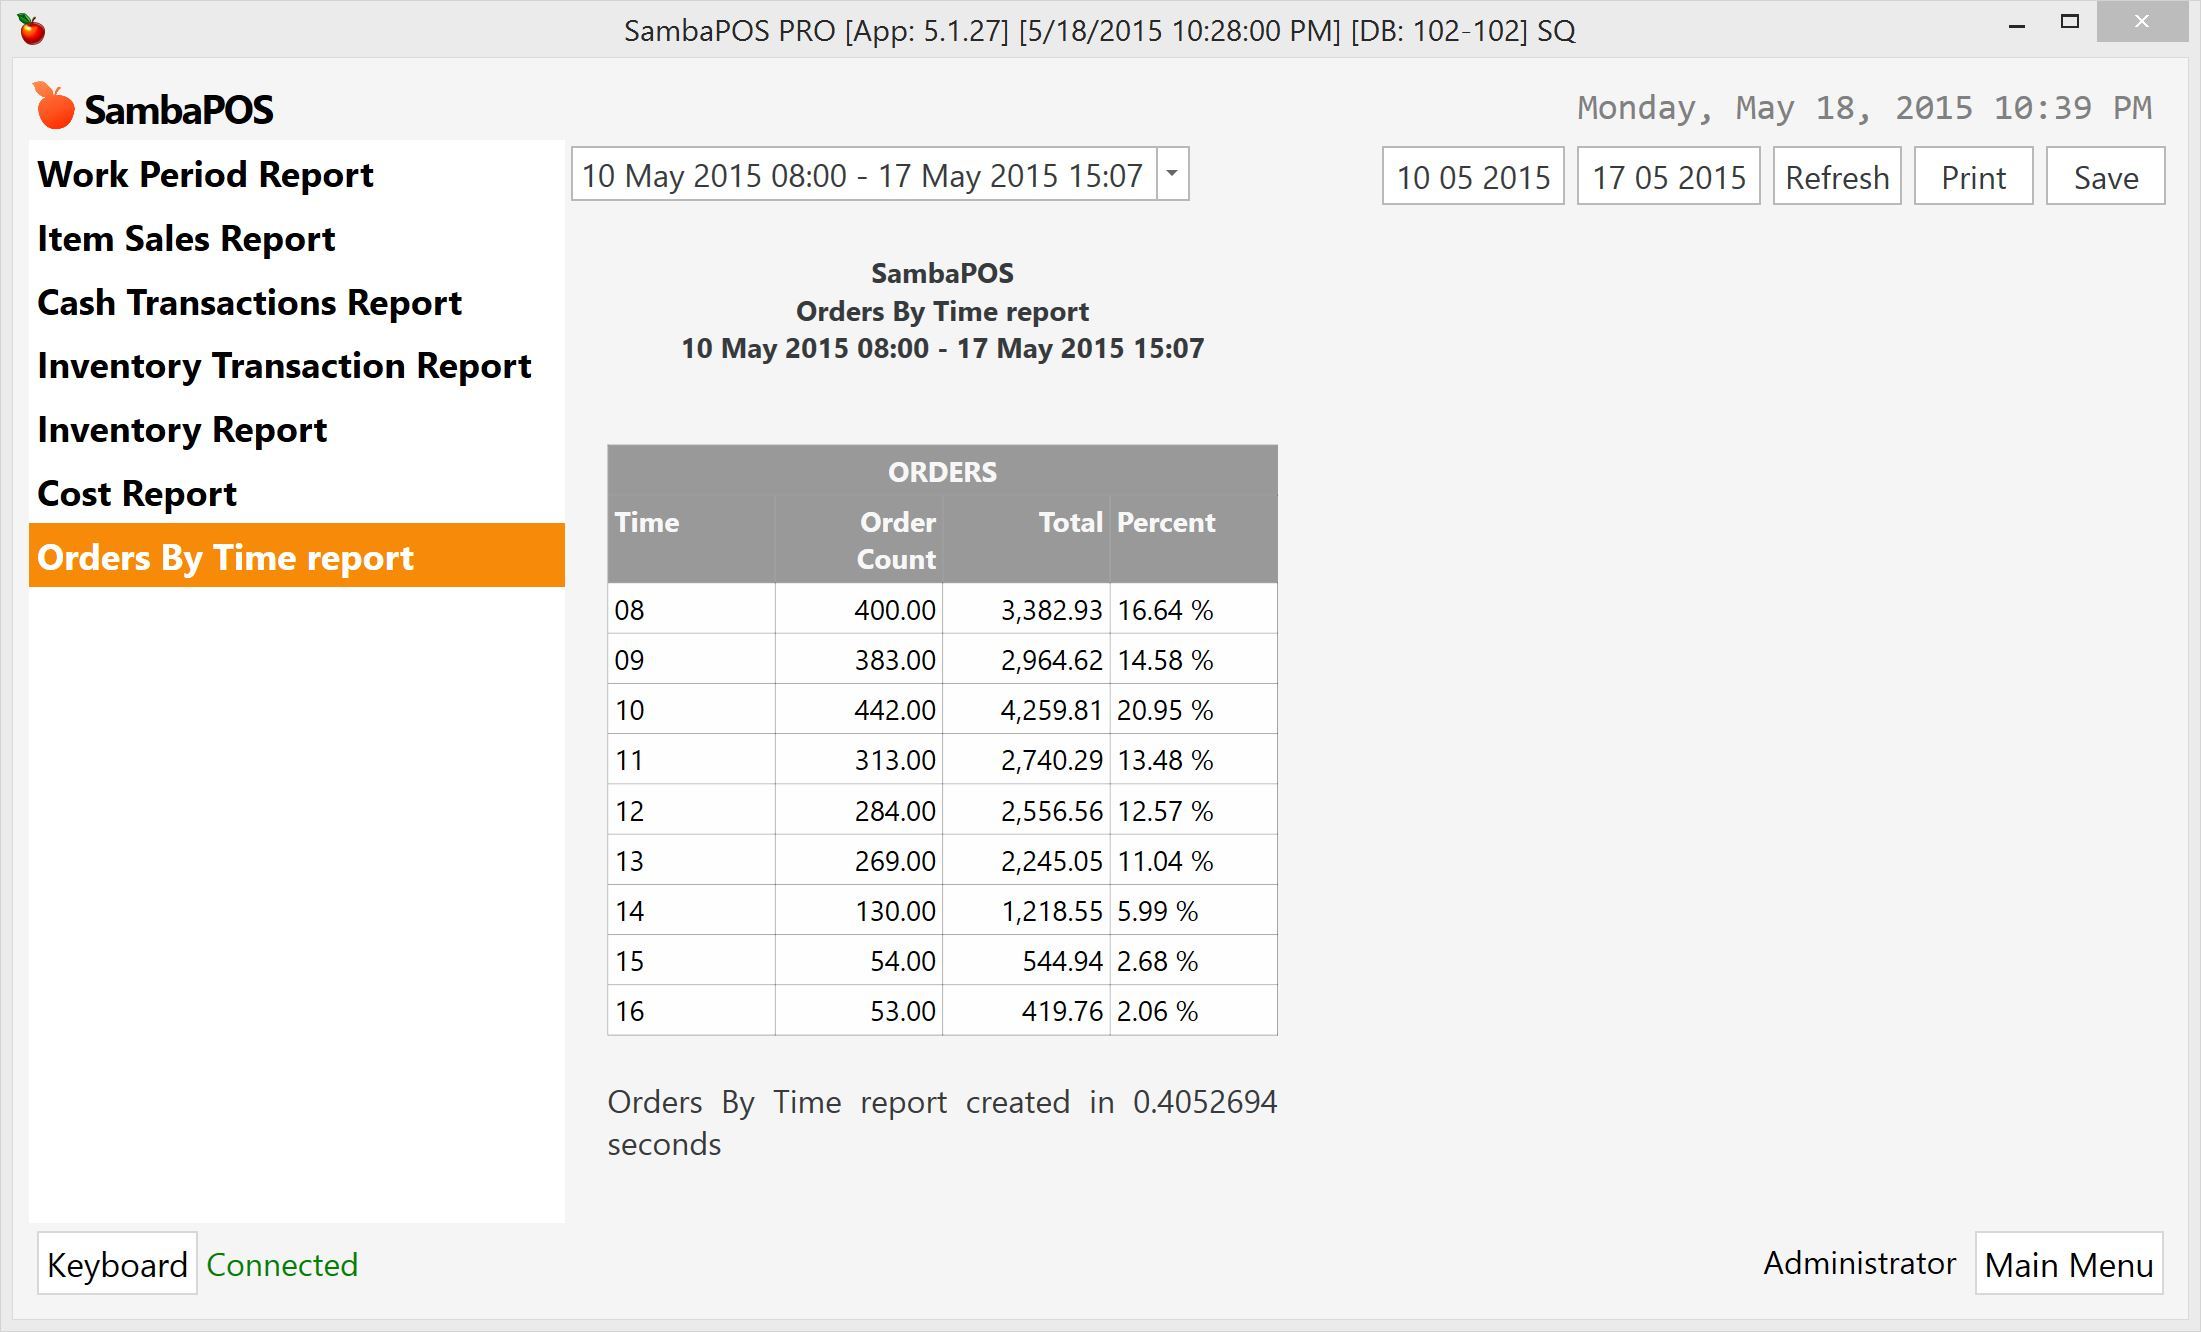
For next version I’ve added Format Time (FT) function support to V5 reports so you can create something like that.

[ORDERS:1, 1, 1,1]
>Time|Order Count|Total|Percent
{REPORT ORDER DETAILS:FT([O.Time],'hh'),O.Id.Count,O.Total.Sum,O.Total.Percent}

6 Likes

This is great emre thanks.
I’m trying to help a friend, is there any way we can have this kind of report on v4?

SQL is the only way to create that report in v4. It is a good report. I will put something together.

1 Like

Thanks @QMcKay
I will be waiting

Need to get learning some sql, can’t believe you get a report like that from such a short bit of code. :slight_smile:

This won’t be “short” in SQL.

I need to step out until tomorrow, but I started some code - saving it here until later…

declare @Start datetime = '2015-01-10T00:00:00.000'
declare @End datetime = '2015-01-10T23:59:59.000'
declare @Hour int = 0

declare @tbl_Sales table
    (
    [ID]  INT IDENTITY(1,1) NOT NULL 
   ,[Hour] varchar(5)
   ,[Amount] money
    )

WHILE @Hour < 24
BEGIN
    INSERT INTO @tbl_Sales
    SELECT
      @Hour as [Hour]
    , SUM(CASE WHEN (DATEPART(hour,[Date])>=@Hour AND DATEPART(hour,[Date])<@Hour+1)
               THEN [TotalAmount]
               ELSE 0 END) as [Amount]
    FROM [dbo].[Tickets]
    WHERE [Date]>=@Start AND [Date]<=@End
SET @Hour = @Hour + 1
END

SELECT [Hour], [Amount] FROM @tbl_Sales
3 Likes

@QMcKay I think GROUP BY does something similar?

Select Datepart(hour,Date) as Hour, Sum(TotalAmount) from Tickets
Group by Datepart(hour,Date)
Order by Datepart(hour,Date)

PS: Original date report sample used case method to display pre-defined time range (eg 9-12) totals as table columns.

1 Like

Yes, thank you @emre - that works really well for a quick look. It is nice and short, and does the job.

The thing I personally don’t like about it though is that hours are skipped (not displayed) if there are no sales within the hour, so it leaves holes in your data chart (missing rows). I would rather it display all requested hours within a time-frame, even if the sale amount within the hour is 0.

Here is a much shorter version using a WHILE loop and a @temp Table …

declare @Start datetime = '2015-01-10T00:00:00.000'
declare @End datetime = '2015-01-10T23:59:59.000'
declare @Hour int = 0

declare @tbl_Sales table
    (
    [ID]  INT IDENTITY(1,1) NOT NULL 
   ,[Hour] varchar(5)
   ,[Amount] money
    )

WHILE @Hour < 24
BEGIN
    INSERT INTO @tbl_Sales
    SELECT
      @Hour as [Hour]
    , SUM(CASE WHEN (DATEPART(hour,[Date])>=@Hour AND DATEPART(hour,[Date])<@Hour+1)
               THEN [TotalAmount]
               ELSE 0 END) as [Amount]
    FROM [dbo].[Tickets]
    WHERE [Date]>=@Start AND [Date]<=@End
SET @Hour = @Hour + 1
END

SELECT [Hour], [Amount] FROM @tbl_Sales

Output:

2 Likes

Ok, I missed something obviously, excuse my ignorance.
If that’s the same report in sql what code was @emre post in?

Presumably this is hard coded samba report based code rather than sql then?

There are two ways to generate reports. You can use Report Tags which is what Emre showed or you can use SQL and call it with a handler like @@sql

More info on the report tags:

http://sambapos.com/wiki/doku.php?id=custom_reporting_tags

Report tags is easier if you do not know SQL. SQL technically can do more because its not bound by tags that need to be implemented. Report tags may be faster for some situations as well but typically there is no difference.

@QMcKay is seasoned with SQL so he can do some impressive reports. I prefer the Report Tags and Emre is very good at implementing tags as we need them. The tags implementation is slowly getting very advanced you can almost do anything you need with the tags without needing to know SQL.

As you can see the tags also allow you to simplify the report syntax. Emre basically did a report like what Q was doing with a few lines of code vs pages of code SQL might require.

BTW when I say SQL what i really mean is a SQL query

3 Likes

Thanks, well explained.
It obviously wouldn’t heart to learn a bit of sql but report tags will do for now :slight_smile:

Here we go … this will work in v4 or v5.

Set the first 2 declarations to use ‘{Start}’ and ‘{End}’ respectively if you want to use this SQL in a Report.

Set the next 2 declarations for the First and Last hour that you want results for. These could also be parameterized as @1 and @2 if you are going to feed the values into the SQL via a Report.

declare @StartDate datetime = '2015-01-02T00:00:00.000' -- use '{Start}' here
declare @EndDate datetime = '2015-01-02T23:59:59.000'   -- use '{End}' here
declare @StartHour int = 6 -- set the First Hour you want to track or use @1 parameter
declare @EndHour int = 22  -- set the Last Hour you want to track or use @2 parameter

/************************************/

declare @Hour int = 0
declare @TotalSales money = 0.00

declare @tbl_Sales table
(
[ID]  INT IDENTITY(1,1) NOT NULL 
,[Hour] varchar(5)
,[Amount] decimal(9,2)
,[Tickets] int
,[AvgTx] decimal(5,2)
,[Percent] decimal(5,2)
)

set @Hour = @StartHour

WHILE @Hour < @EndHour+1
BEGIN
    INSERT INTO @tbl_Sales
    SELECT
      @Hour as [Hour]
    , SUM(CASE WHEN (DATEPART(hour,[Date])>=@Hour AND DATEPART(hour,[Date])<@Hour+1)
               THEN [TotalAmount]
               ELSE 0 END) as [Amount]
    , COUNT(CASE WHEN (DATEPART(hour,[Date])>=@Hour AND DATEPART(hour,[Date])<@Hour+1)
               THEN 1
               ELSE null END) as [Tickets]
    ,0,0
    FROM [dbo].[Tickets]
    WHERE [Date]>=@StartDate AND [Date]<=@EndDate
SET @Hour = @Hour + 1
END

INSERT INTO @tbl_Sales
SELECT 'TTL', sum([Amount]), sum([Tickets]), 0, 0 FROM @tbl_Sales

set @TotalSales = (SELECT [Amount] FROM @tbl_Sales WHERE [Hour]='TTL')

UPDATE @tbl_Sales SET
 [AvgTx] = (CASE WHEN [Tickets]=0 THEN 0 ELSE [Amount]/[Tickets] END)
,[Percent] = [Amount]/@TotalSales * 100

SELECT CASE
WHEN isnumeric([Hour])=1
THEN (CASE WHEN [Hour]<10 THEN '0'+[Hour] ELSE [Hour] END)+':00'
ELSE [Hour]
END as [Hour]
, [Amount], [Tickets], [AvgTx], [Percent]
FROM @tbl_Sales

Output:


##Making a Report##

Report Template:

[Sales Per Hour: 15, 25, 15, 20, 20]
>Hour|Sales|Tx|AvgTx|%Sales
@@SalesPerHour:6,22


@@SalesPerHour (SQL Script in Automation > Scripts)

declare @StartDate datetime = '{Start}' -- use '{Start}' here
declare @EndDate datetime = '{End}'   -- use '{End}' here
declare @StartHour int = @1 -- set the First Hour you want to track
declare @EndHour int = @2  -- set the Last Hour you want to track

/************************************/

declare @Hour int = 0
declare @TotalSales money = 0.00

declare @tbl_Sales table
(
[ID]  INT IDENTITY(1,1) NOT NULL 
,[Hour] varchar(5)
,[Amount] decimal(9,2)
,[Tickets] int
,[AvgTx] decimal(5,2)
,[Percent] decimal(5,2)
)

set @Hour = @StartHour

WHILE @Hour < @EndHour+1
BEGIN
    INSERT INTO @tbl_Sales
    SELECT
      @Hour as [Hour]
    , SUM(CASE WHEN (DATEPART(hour,[Date])>=@Hour AND DATEPART(hour,[Date])<@Hour+1)
               THEN [TotalAmount]
               ELSE 0 END) as [Amount]
    , COUNT(CASE WHEN (DATEPART(hour,[Date])>=@Hour AND DATEPART(hour,[Date])<@Hour+1)
               THEN 1
               ELSE null END) as [Tickets]
    ,0,0
    FROM [dbo].[Tickets]
    WHERE [Date]>=@StartDate AND [Date]<=@EndDate
SET @Hour = @Hour + 1
END

INSERT INTO @tbl_Sales
SELECT 'TTL', sum([Amount]), sum([Tickets]), 0, 0 FROM @tbl_Sales

set @TotalSales = (SELECT [Amount] FROM @tbl_Sales WHERE [Hour]='TTL')

UPDATE @tbl_Sales SET
 [AvgTx] = (CASE WHEN [Tickets]=0 THEN 0 ELSE [Amount]/[Tickets] END)
,[Percent] = [Amount]/@TotalSales * 100

SELECT [Hour], [Amount], [Tickets], [AvgTx], [Percent] FROM @tbl_Sales


Output:

1 Like

Uh lol… I never thought that. Great point.

Another difference is SQL runs server side, Custom Reports fetches and process data on client side. Learning SQL will open new opportunities as you won’t limit yourself with custom reports language but for most common cases Custom Reports will try to offer simple solutions.

2 Likes

Could I get some help on showing void reports? V4 actually showed the user that voided however V5 only shows really simple void report.

Id really love it if I could get user that voided, time of void, item, quantity, and total.

@eddhasaj that report should be fairly easy to do with Report Tags. Did you not look over the Custom Report Tags post I linked to you in your other post about this?