##Adding SQL Scripts
You can display values of a SQL Script result in reports. If SQL Scripts returns a single value you can use it as a cell value. If it returns multiple values that will be formatted as a table row. In other words SQL result will be converted to a | delimited value.
###Creating a script
In this section samples won’t be real SQL scripts. I’ll just show you how you can link SQL results with custom reports.
Navigate to Management > Automation > Scripts to create a new script.
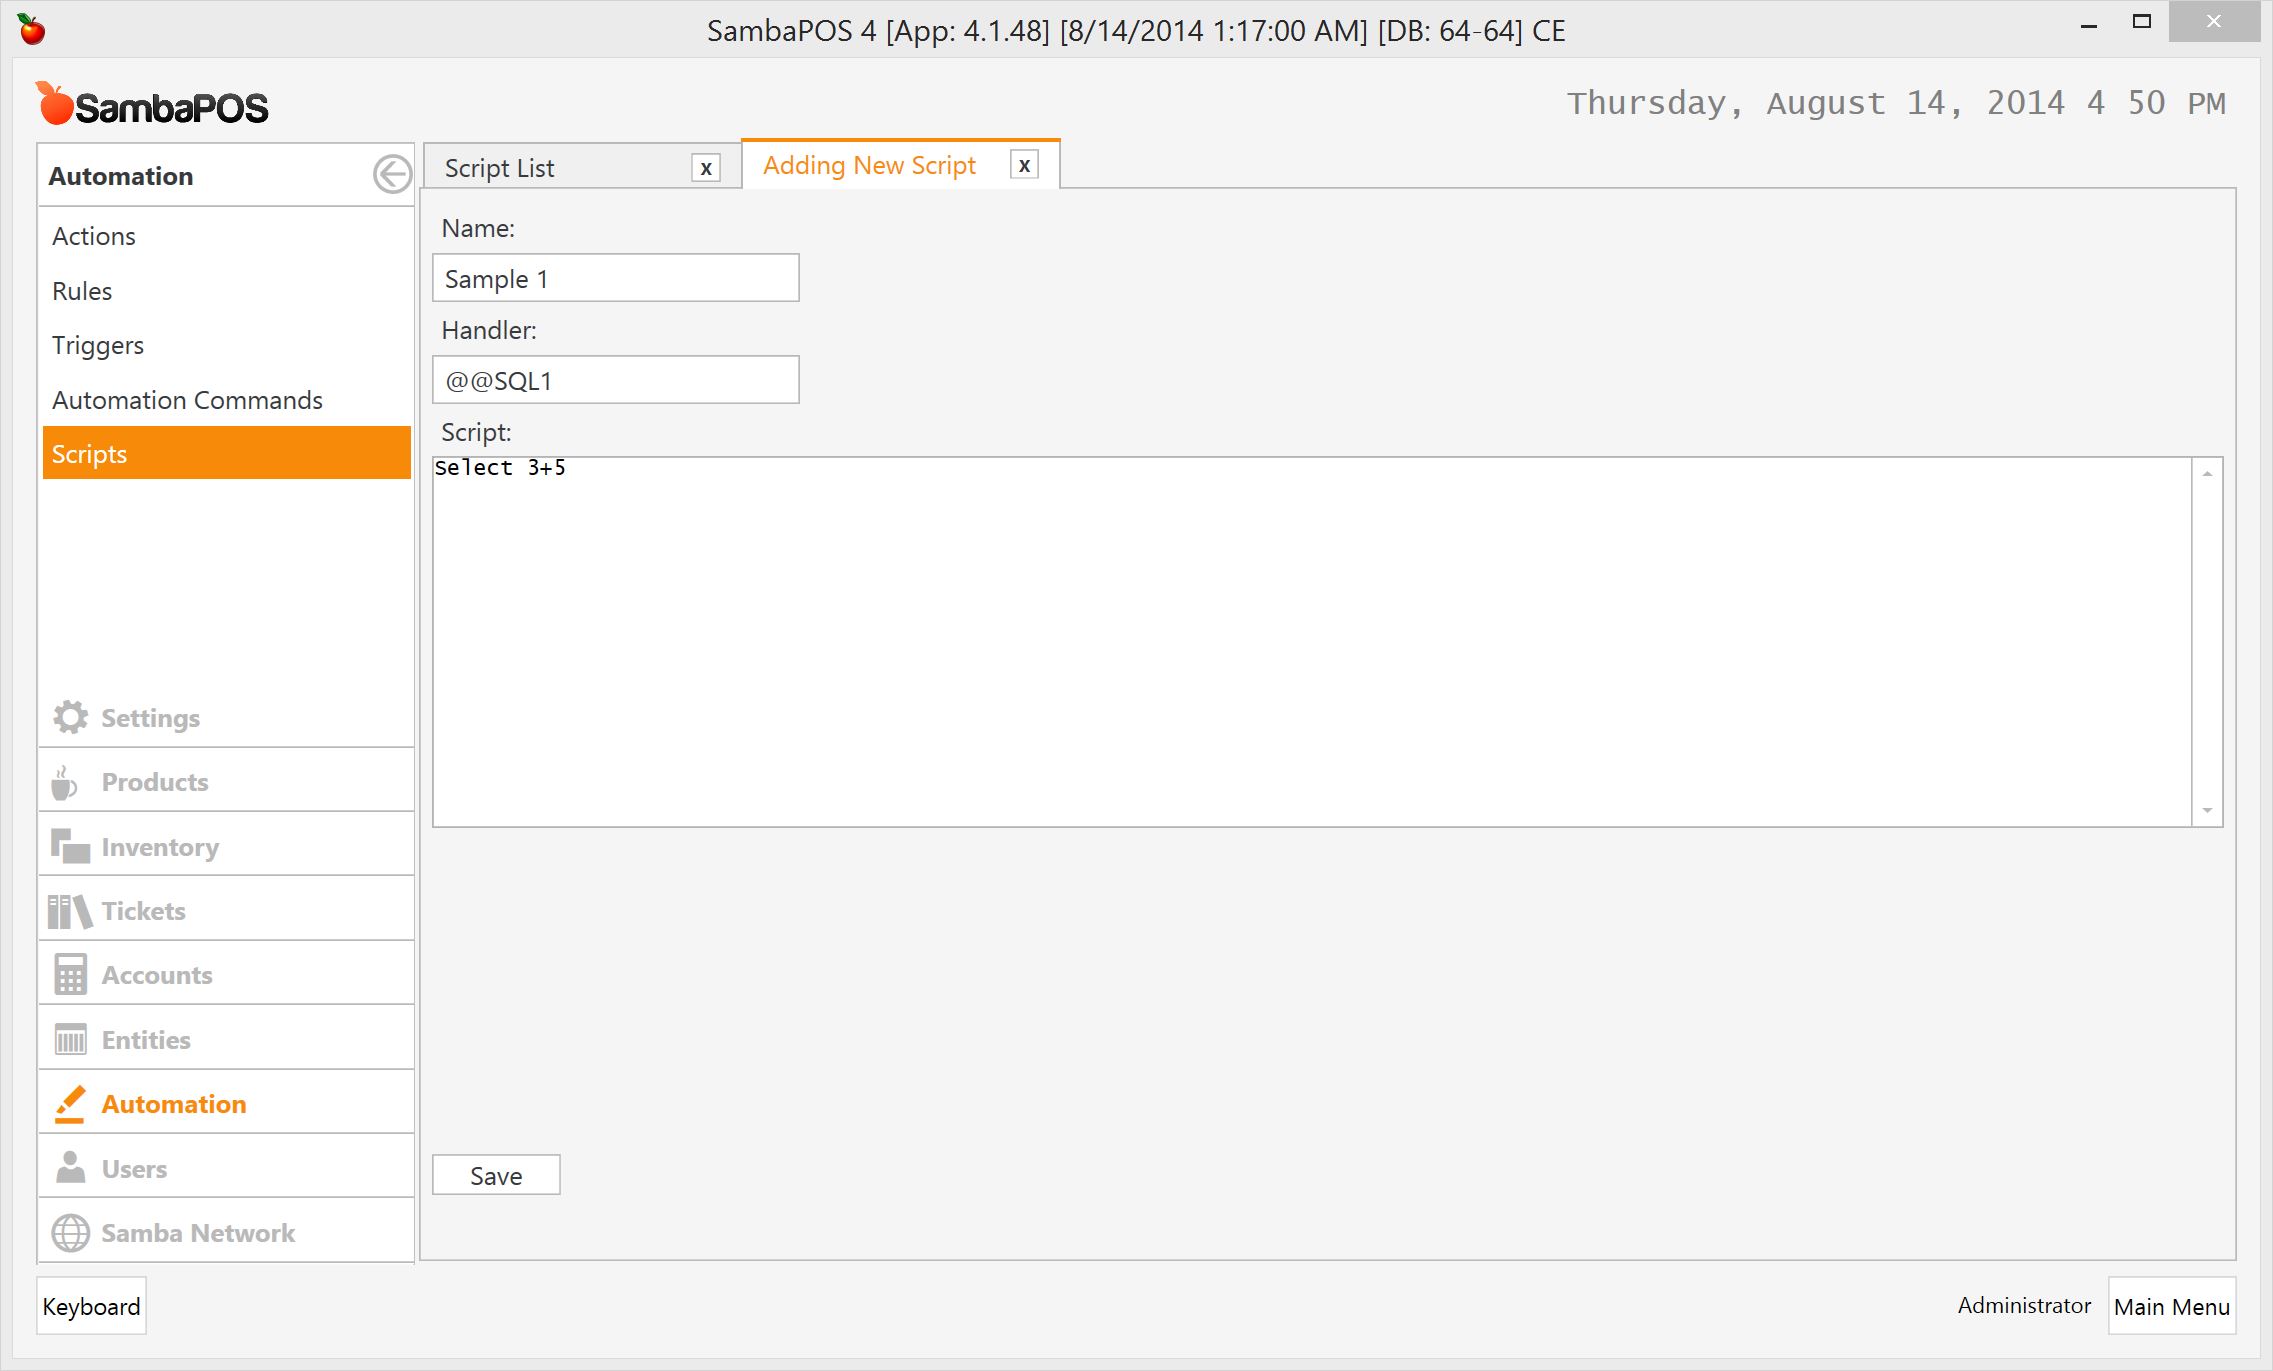
Select 5+3 script will only return the result of calculation.

Handleris the name we’ll reference from reports. It should start with@@and should not contain spaces.
After saving it @@SQL1 will display the result of our calculation in reports.
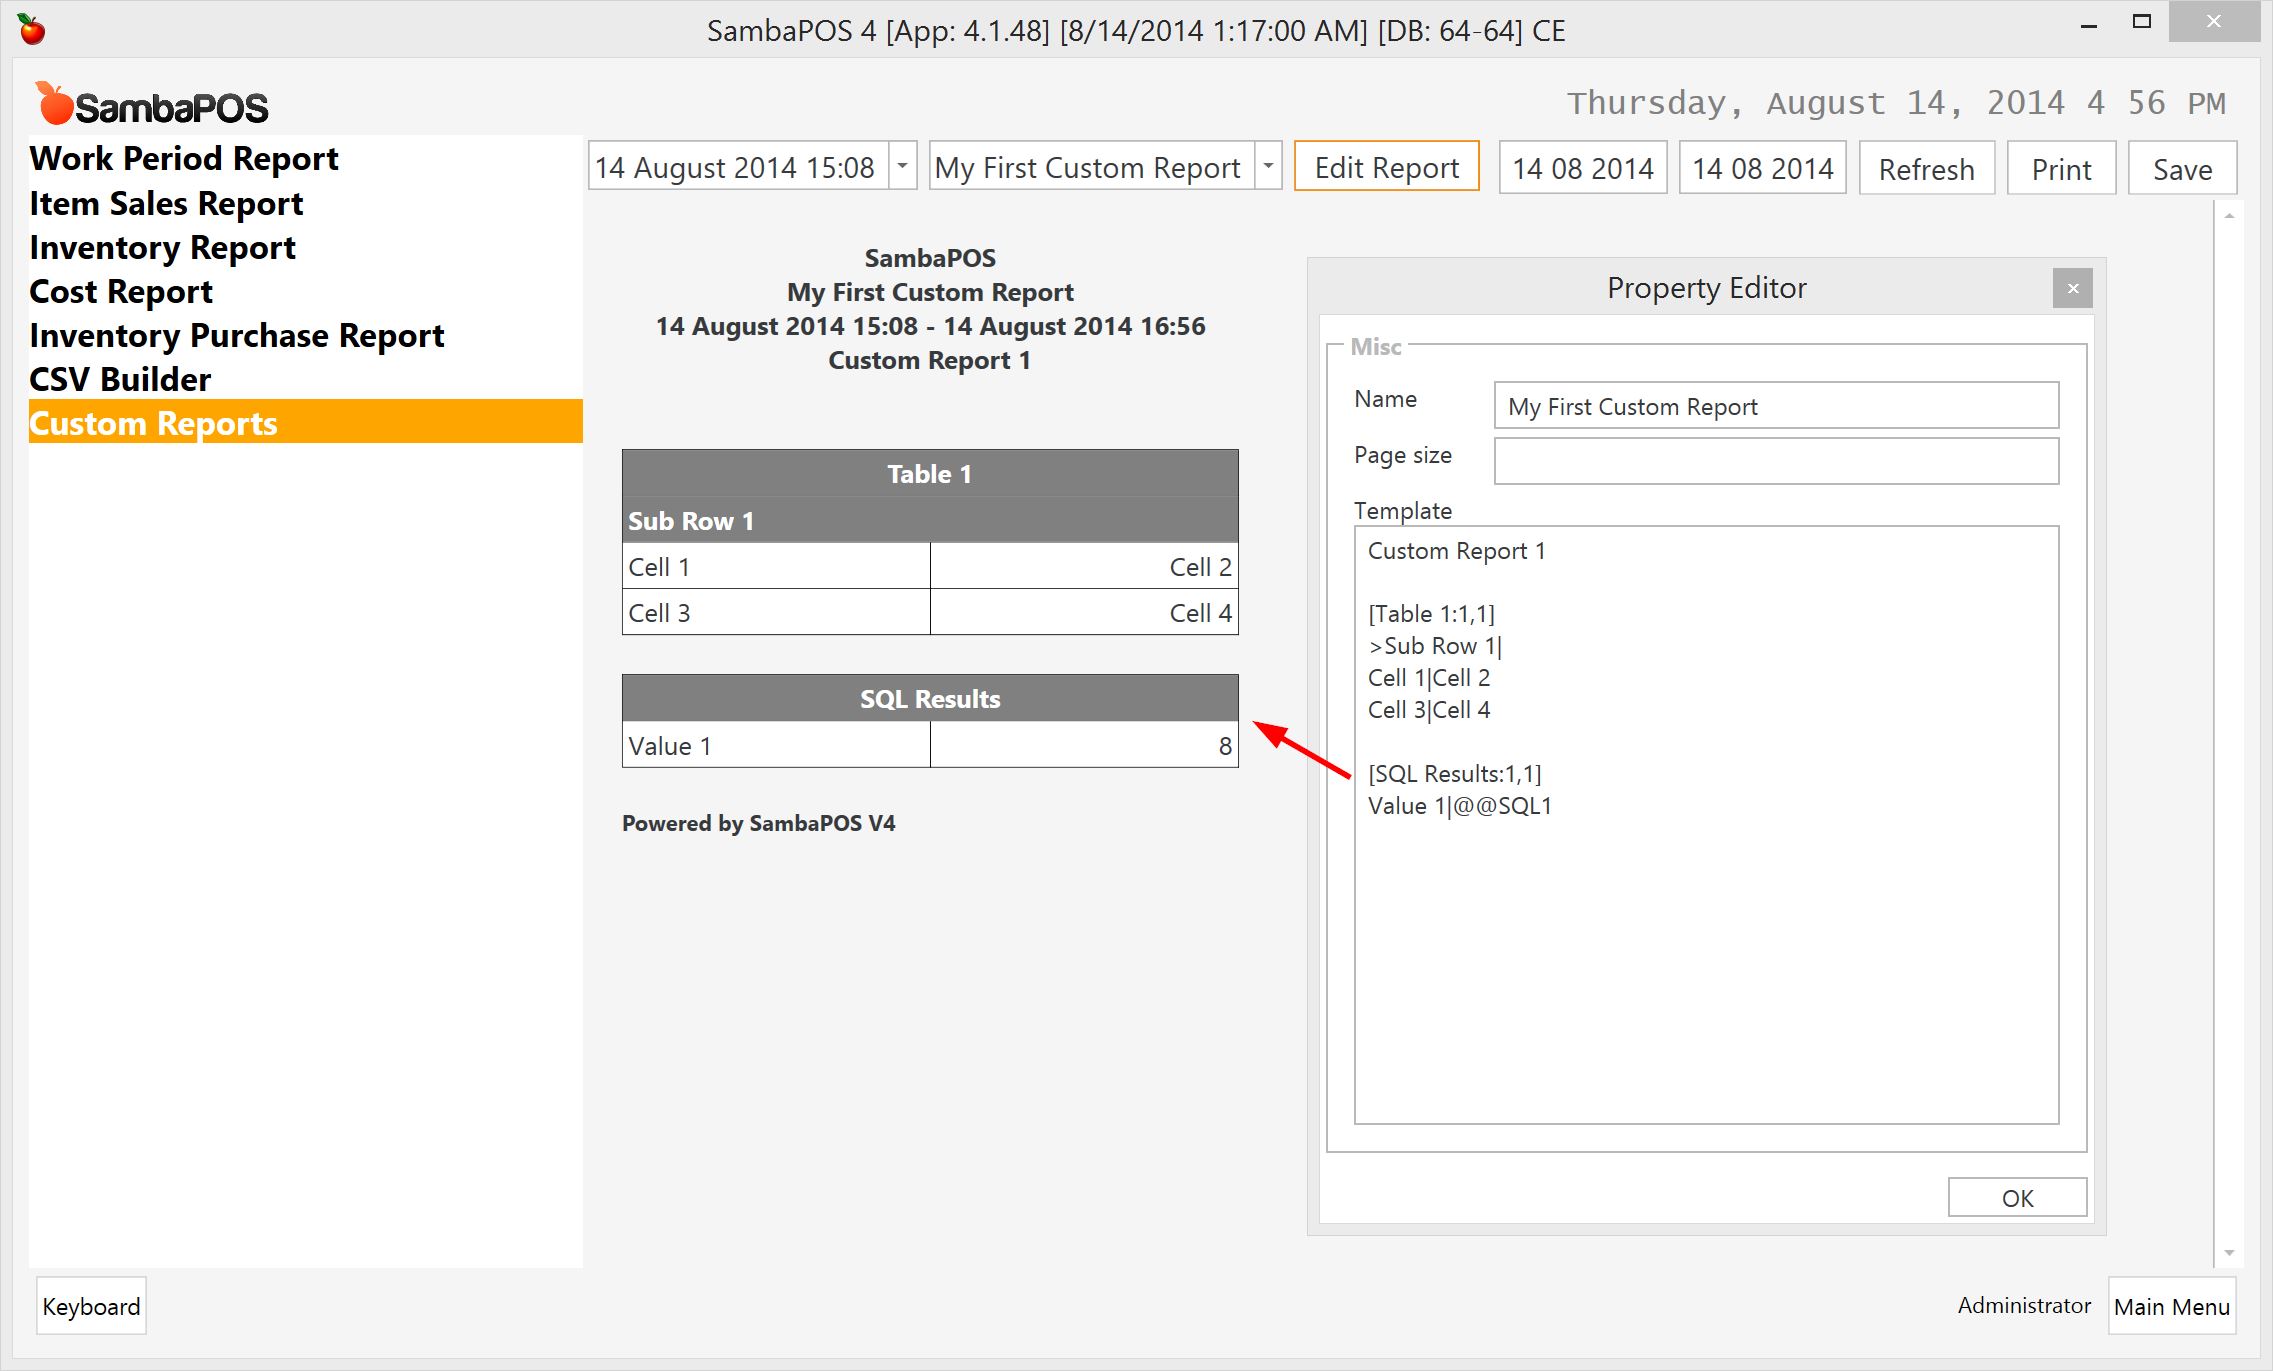
@@SQL1 value replaced with 8 (5+3)
Since our table have 2 columns we can return 2 values as the result of @@SQL1 and use it as a row.
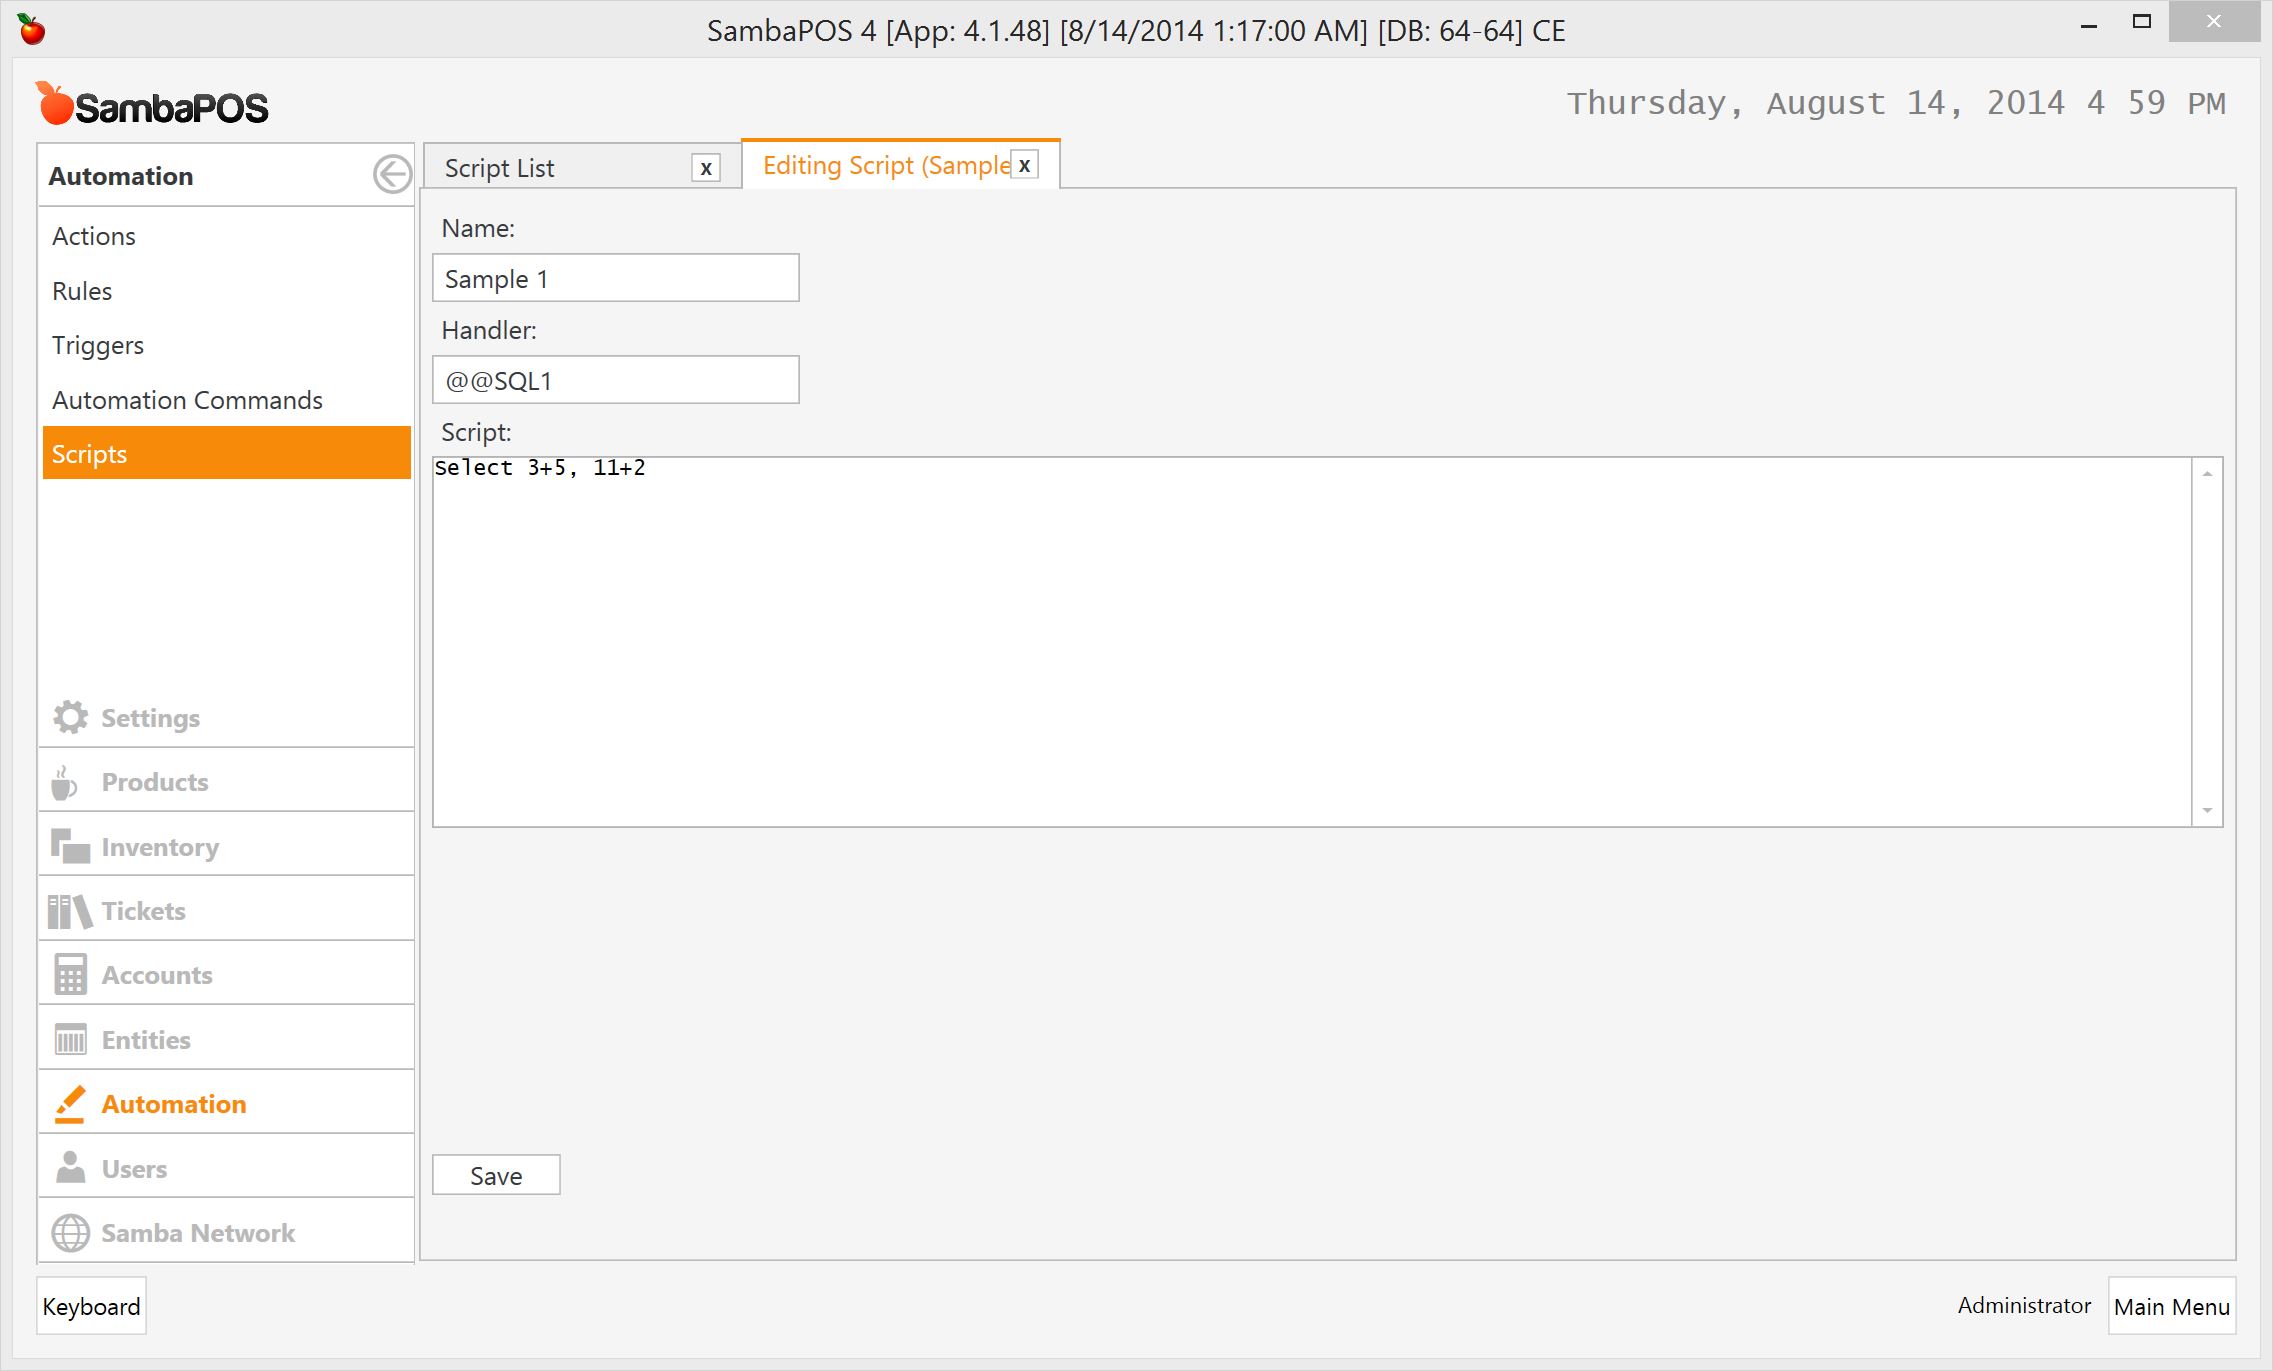
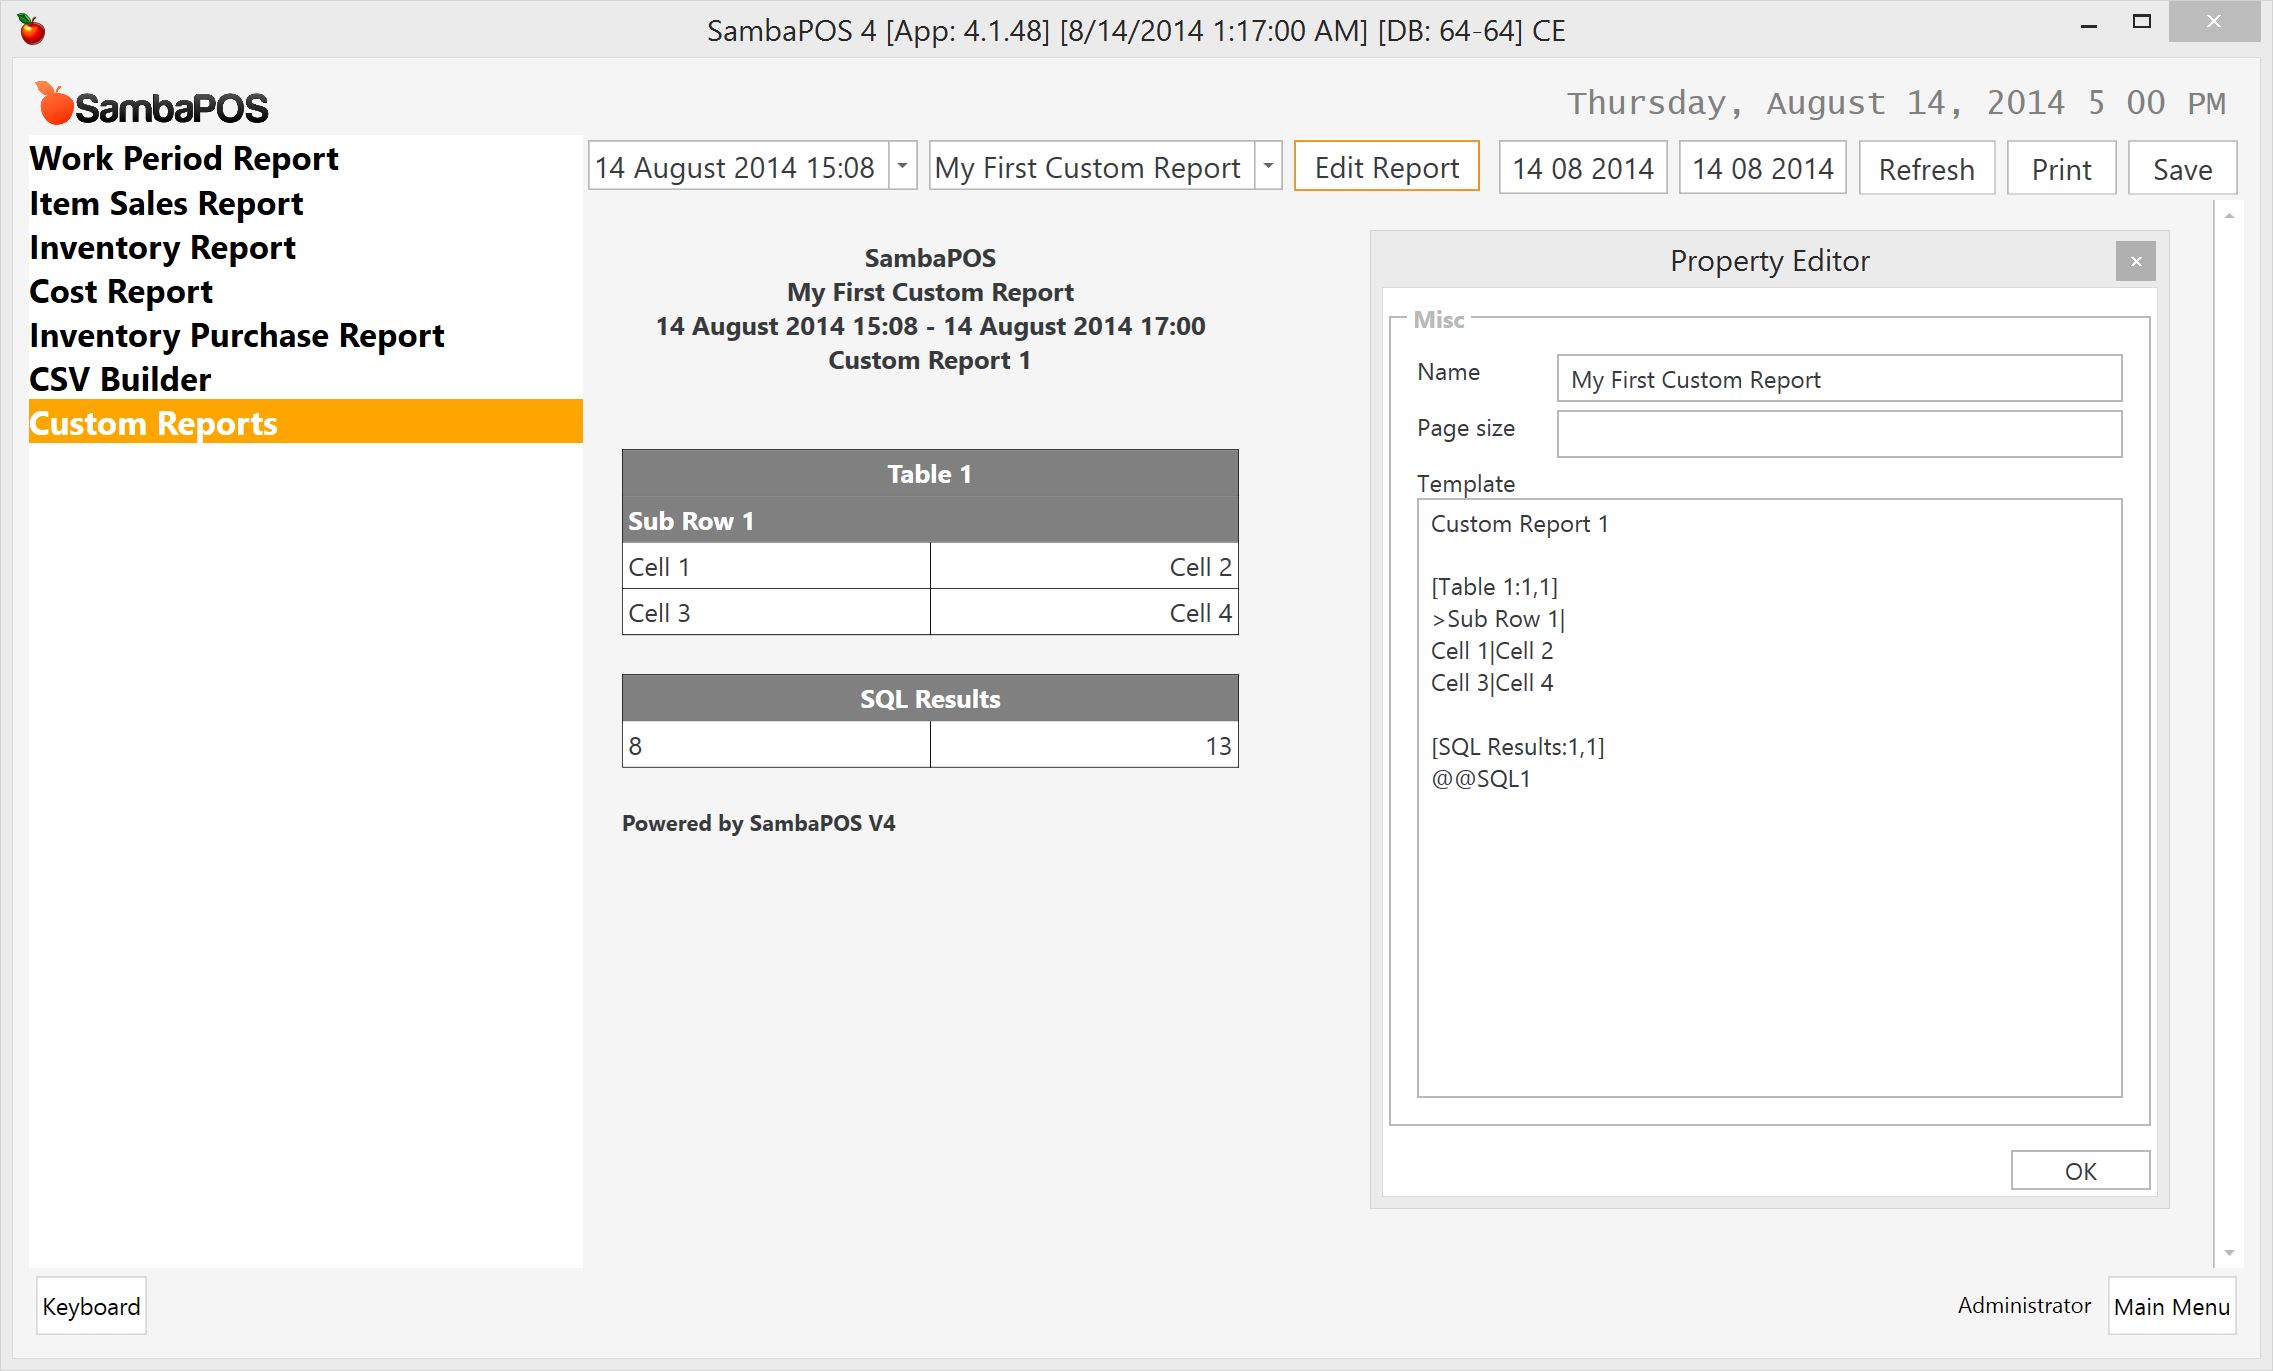
I’ll add another expression to SQL script so it will return a single row with two columns. Since it returns multiple values I’ll use it as whole row value. SambaPOS will automatically convert result to a | delimited row as Value|Value2.
##A Real Example
This scripts displays ticket counts by peak hours.
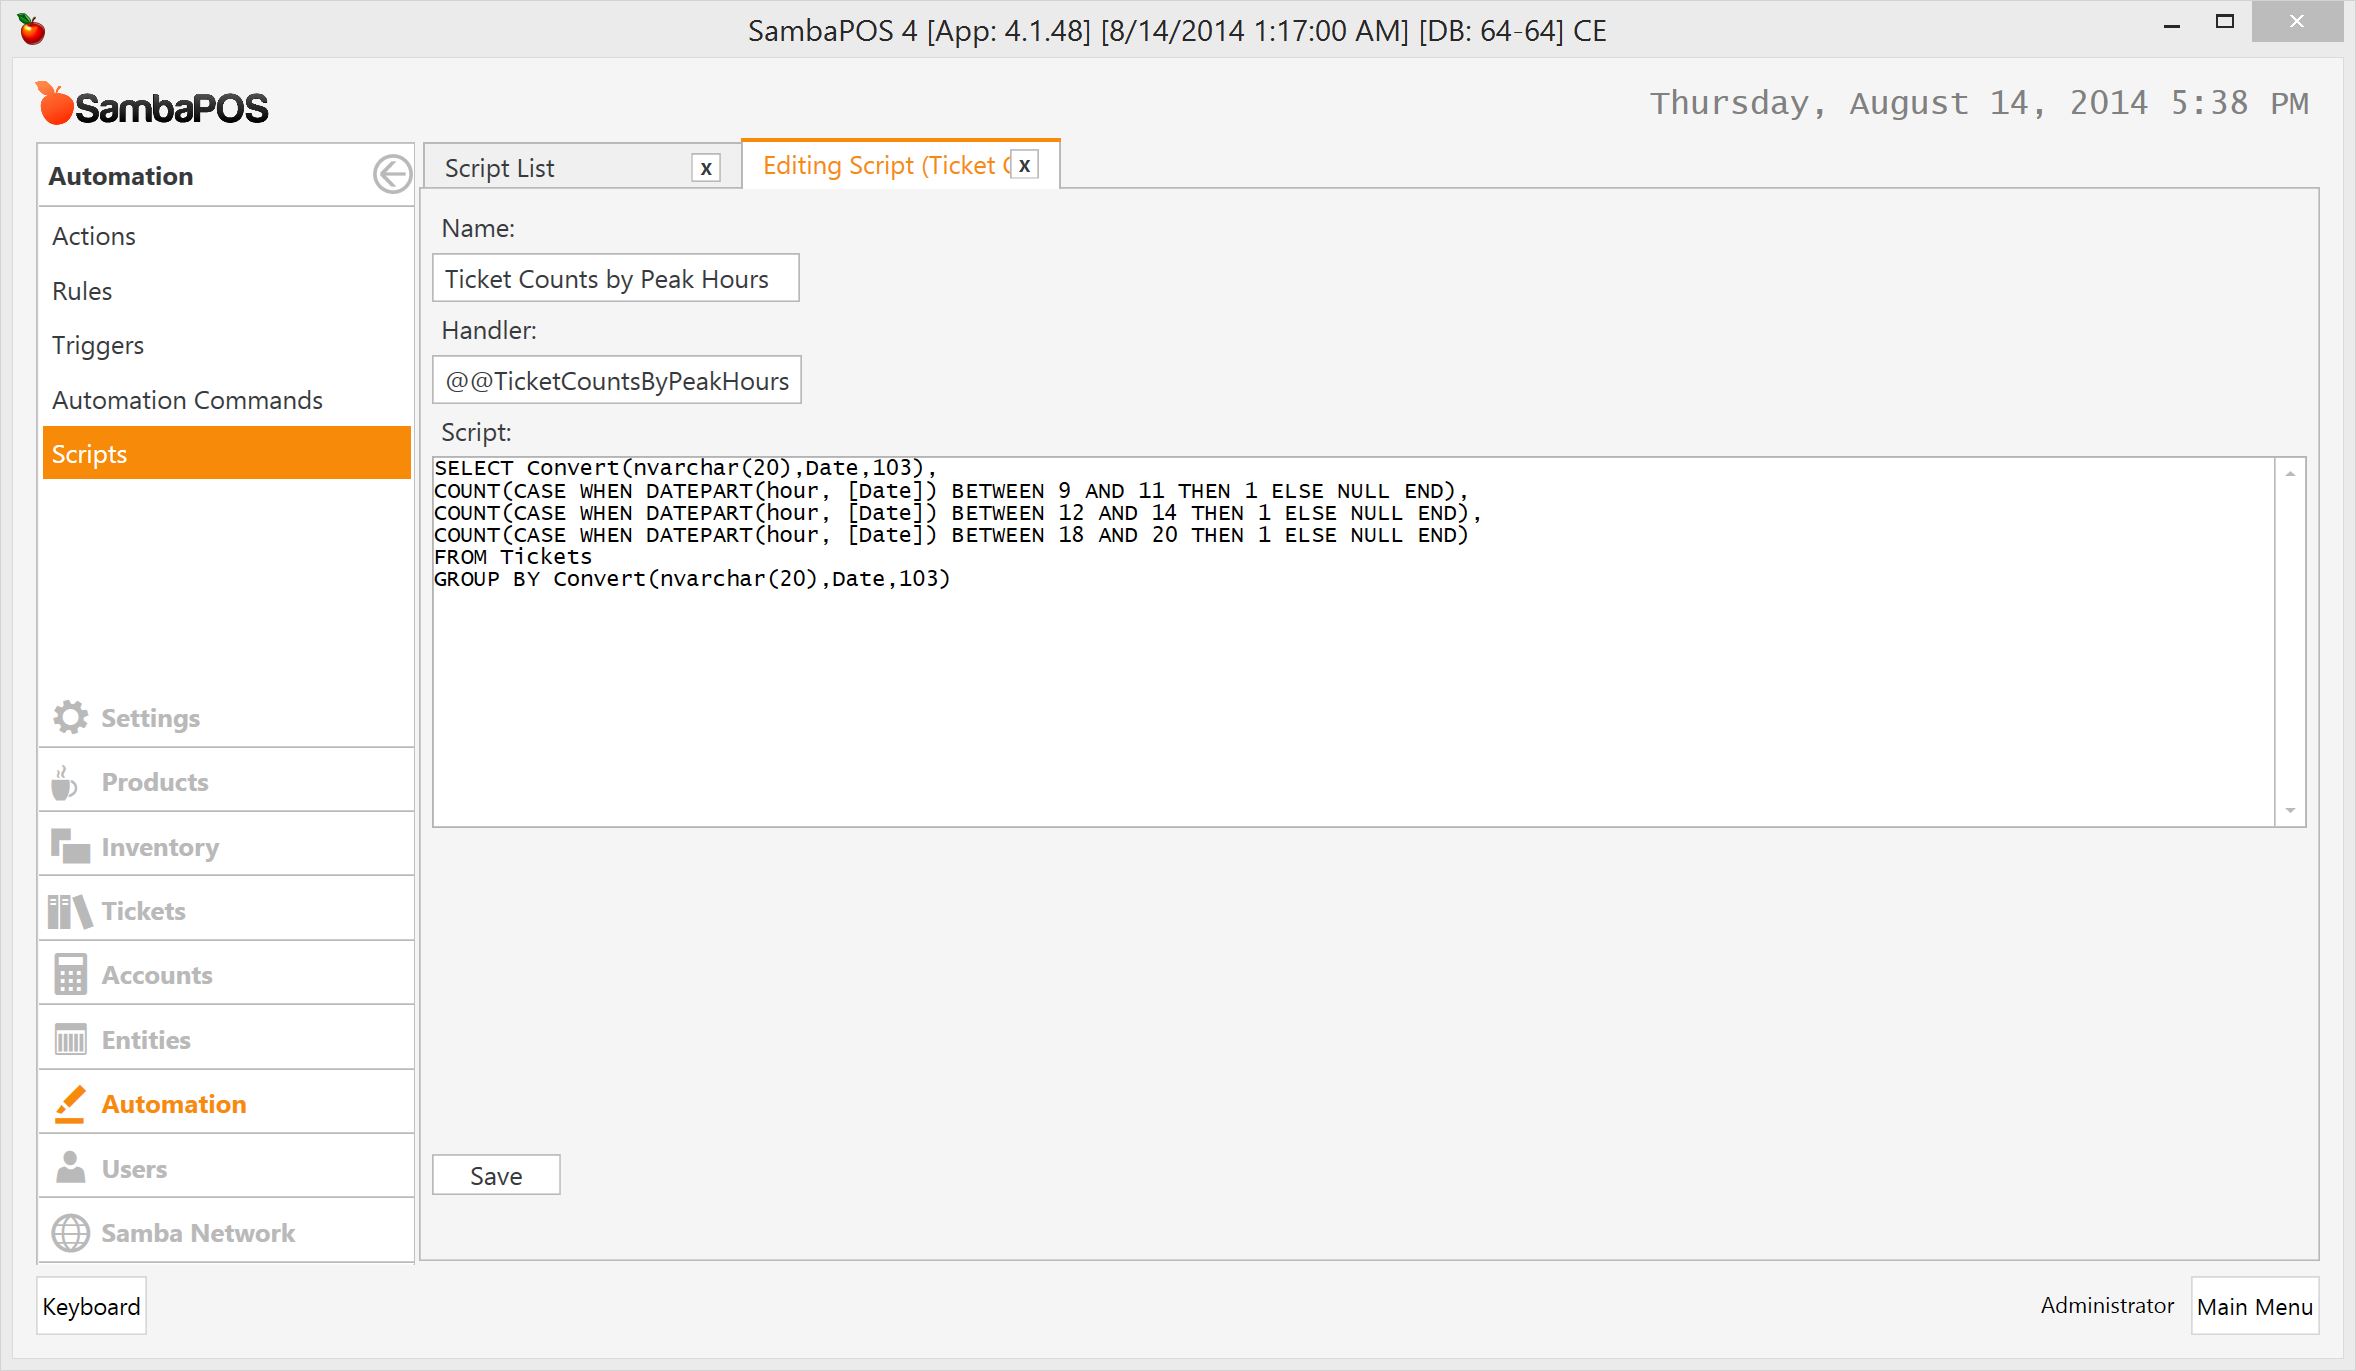
SELECT Convert(nvarchar(20),Date,103),
  COUNT(CASE WHEN DATEPART(hour, [Date]) BETWEEN 9 AND 11 THEN 1 ELSE NULL END),
  COUNT(CASE WHEN DATEPART(hour, [Date]) BETWEEN 12 AND 14 THEN 1 ELSE NULL END),
  COUNT(CASE WHEN DATEPART(hour, [Date]) BETWEEN 18 AND 20 THEN 1 ELSE NULL END)
FROM Tickets
  GROUP BY Convert(nvarchar(20),Date,103)
It returns 4 columns per row so we should prepare a 4 column table. I’ve created a new report by choosing Add Report from report selection drop down and named it as Ticket Counts by Peak Hours.
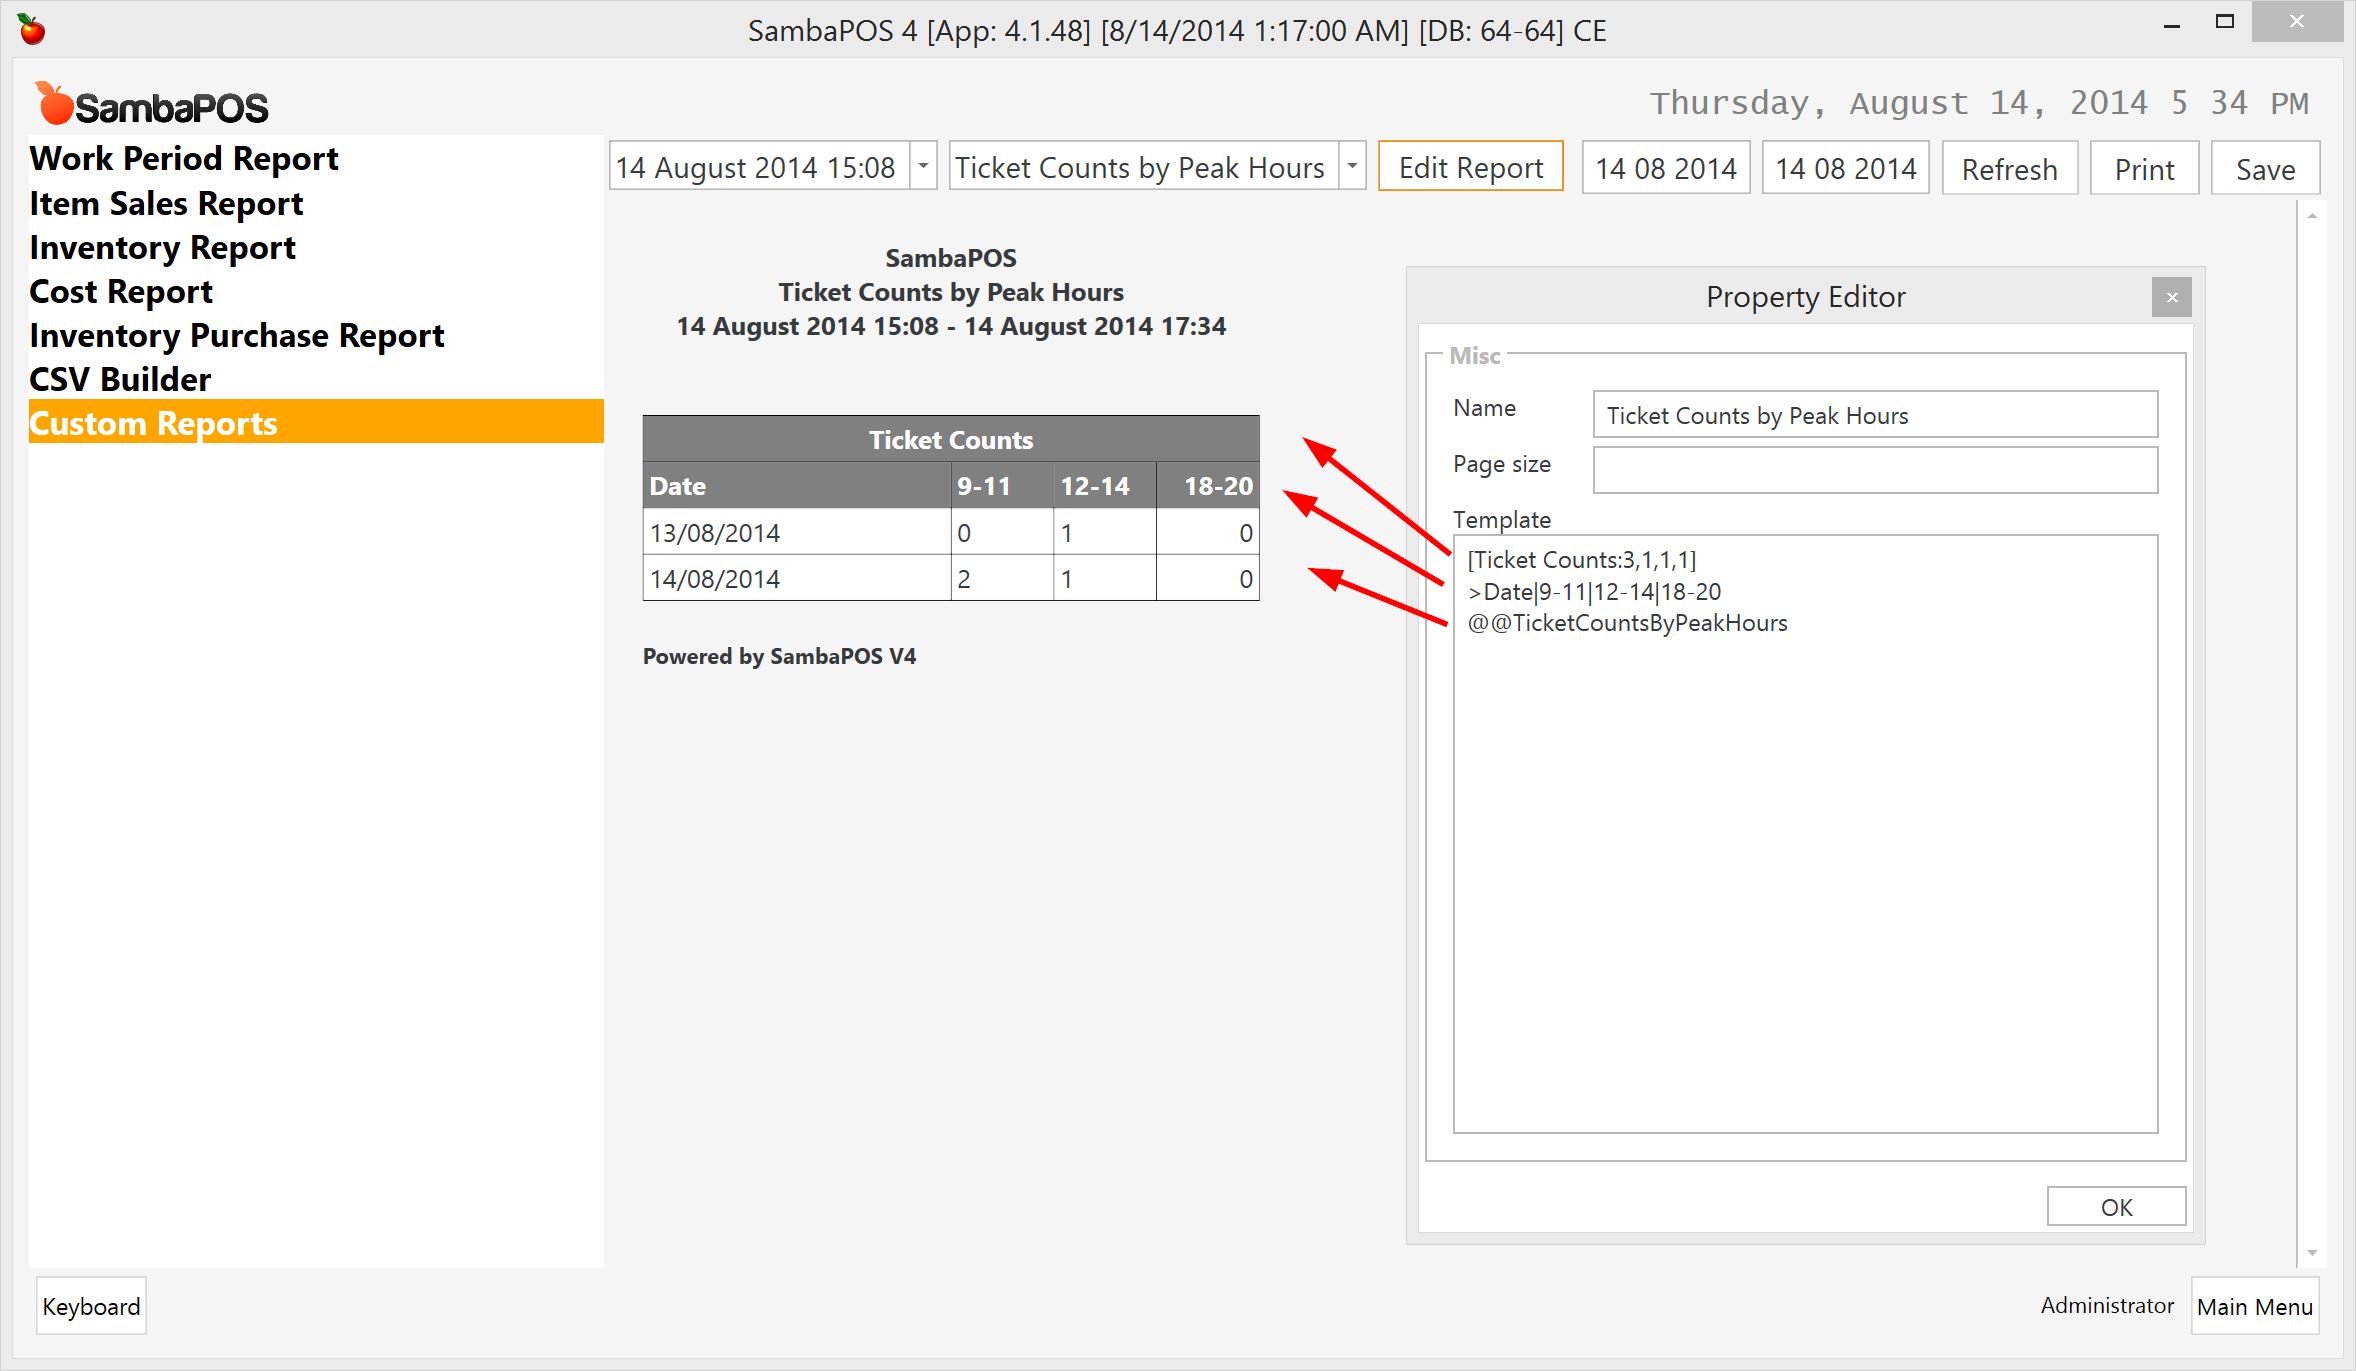
I don’t have enough data to display a better report but it should display ticket counts created between specified hours.
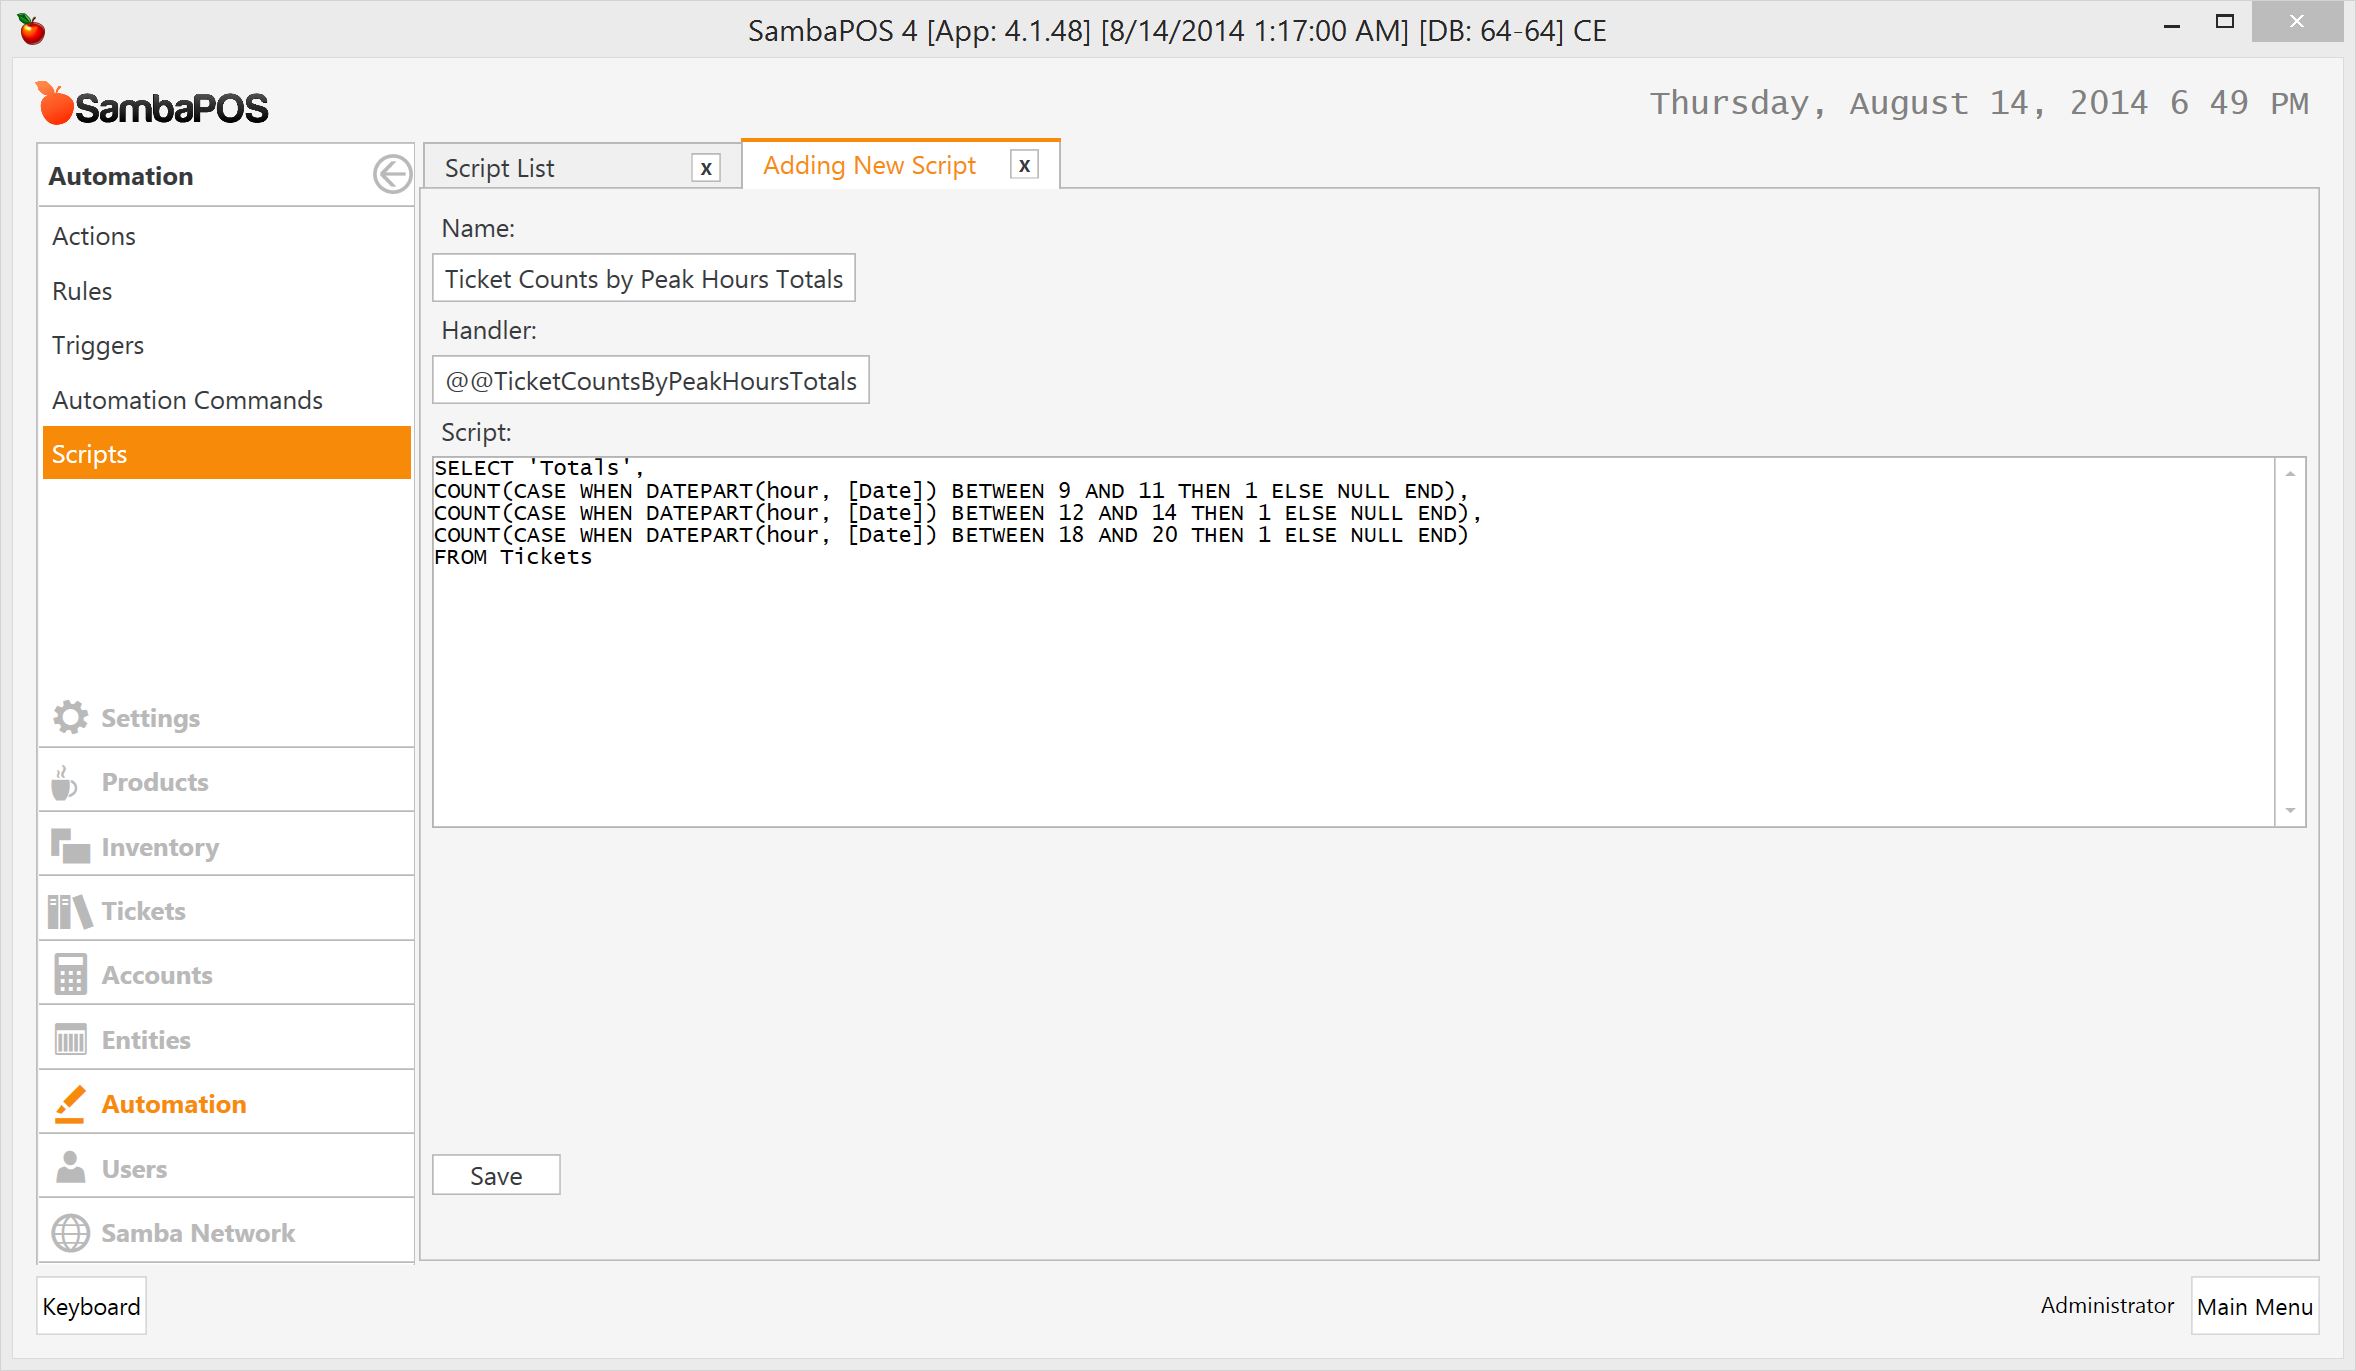
###Adding Totals to Report
To display a summary under table we’ll use another Sql Script.
SELECT 'Totals',
  COUNT(CASE WHEN DATEPART(hour, [Date]) BETWEEN 9 AND 11 THEN 1 ELSE NULL END),
  COUNT(CASE WHEN DATEPART(hour, [Date]) BETWEEN 12 AND 14 THEN 1 ELSE NULL END),
  COUNT(CASE WHEN DATEPART(hour, [Date]) BETWEEN 18 AND 20 THEN 1 ELSE NULL END)
FROM Tickets
I’ll create a new script. We’ll use a different handle for that script.
… and I’ll update my report as shown here.
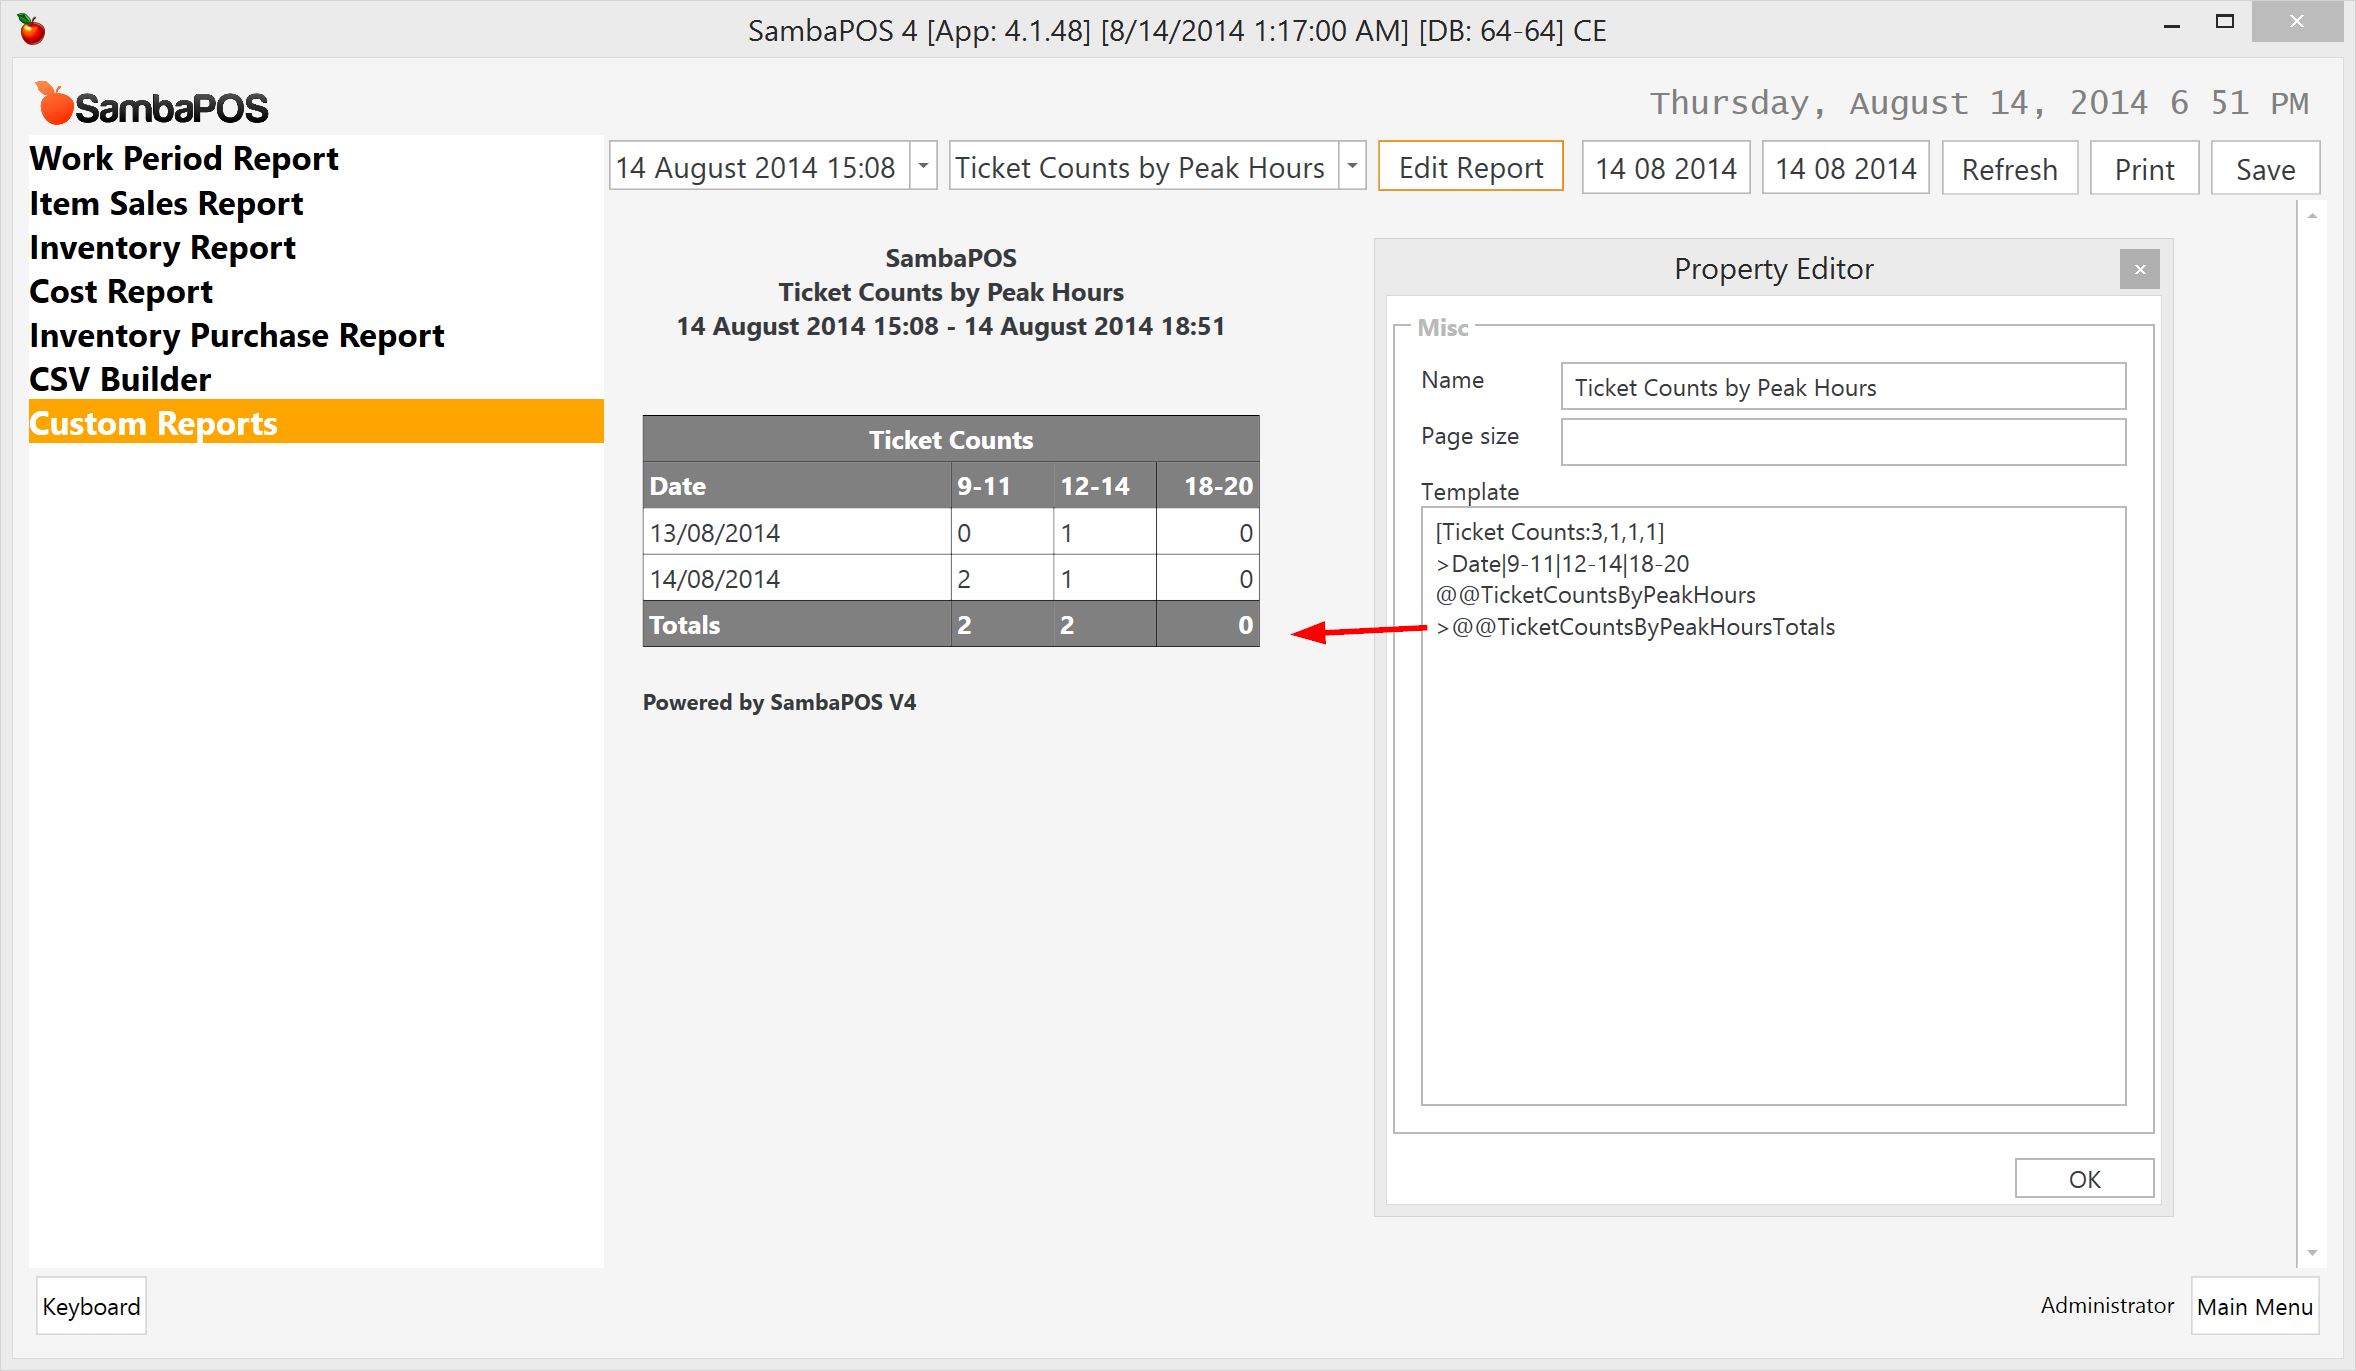
Adding > char in front of the row will convert it to a bold row.