[NEW!] How to use Custom Reports Module 1.0

Custom Reports Module is an Add On Module for SambaPOS. You can install it through SambaMarket.

That might be a little early release because I have still plans to improve that but instead of improving it by myself I’ve decided to release it and improve it according to your needs.

What Custom Report Module basically does is displaying reports prepared with SQL.

First of all I’ll give some basic information to let you understand how you can structure your reports.

This is how that module appears when you first install it.

Click Add Report to create new report.

Add this template inside report

Custom Report 1

[Table 1:1,1]
>Sub Row 1|
Cell 1|Cell 2
Cell 3|Cell 4

Clicking OK should display…

This is what each template line displays.

Formatting Tables

When we add a Table Tag all lines added under that table tag will appear as a table row.
The Syntax for Table Tag is

[Table Name:Columns]

While defining columns you also define columns sizes. If you need two columns with same size you’ll add 1,1.

[Table Name:1,1]

We’re defining column sizes as percents. Percent = Total number of sizes / Column Size. So it will creates two columns with %50 size.

Examples:

[Table Name:2,1]: it will create two columns and 3/2 (%66) for first column and 3/1 (%33) for second column.

[Table Name:2,1,2]: it will create three columns and 5/2 (%40) for first, 5/1 (%20) and 5/2 (%40) for third column.

###Formatting Rows

Row values are delimited with | (pipe) char. The number of pipes for each row should match table’s column count -1 .

[Table 1:1,1]    >>>>   Creates Two Columns  
Cell 1|Cell 2    >>>>   Has Two values separated with | char.

###Spanning Rows

Empty Values will Span. Cell counts should match with column count

Example 1

[Table 1:1,1]    
Cell 1|Cell 2   
Cell 3|           >>>> This row will appear as a single cell
Cell 4|Cell 5 

Example 2

[Table 1:1,1,1]          >>>> Three Columns    
Cell 1|Cell 2|Cell 3  
Cell 3||Cell 4           >>>> Two Pipes used to match columns
Cell 5|Cell 6|Cell 7 

###Bold Rows

Adding > char before a row will display it as a highlighted bold row. Useful for splitting reports to sections or displaying totals.

###Multiple Tables

A custom report may contain multiple tables.

[Table 1:1,1]
Value 1|Value2

[Table 2:1,1]
Value 3|Value4

###Column Alignments
By default all columns are left aligned. If you add a space before column size value it will align to right.

[Table 1:1, 1]   >> Second 1 starts with a space char
Value 1|Value2      So Value2 column will align to right.
8 Likes

This topic is now invisible. It will no longer be displayed in any topic lists. The only way to access this topic is via direct link.

##Adding SQL Scripts

You can display values of a SQL Script result in reports. If SQL Scripts returns a single value you can use it as a cell value. If it returns multiple values that will be formatted as a table row. In other words SQL result will be converted to a | delimited value.

###Creating a script

:bulb: In this section samples won’t be real SQL scripts. I’ll just show you how you can link SQL results with custom reports.

Navigate to Management > Automation > Scripts to create a new script.

Select 5+3 script will only return the result of calculation.

:warning: Handler is the name we’ll reference from reports. It should start with @@ and should not contain spaces.

:bulb: The reason we are creating SQL Scripts outside reports is making our scripts reusable so we can access them from multiple reports.

After saving it @@SQL1 will display the result of our calculation in reports.

@@SQL1 value replaced with 8 (5+3)

Since our table have 2 columns we can return 2 values as the result of @@SQL1 and use it as a row.

I’ll add another expression to SQL script so it will return a single row with two columns. Since it returns multiple values I’ll use it as whole row value. SambaPOS will automatically convert result to a | delimited row as Value|Value2.

##A Real Example

This scripts displays ticket counts by peak hours.

SELECT Convert(nvarchar(20),Date,103),
  COUNT(CASE WHEN DATEPART(hour, [Date]) BETWEEN 9 AND 11 THEN 1 ELSE NULL END),
  COUNT(CASE WHEN DATEPART(hour, [Date]) BETWEEN 12 AND 14 THEN 1 ELSE NULL END),
  COUNT(CASE WHEN DATEPART(hour, [Date]) BETWEEN 18 AND 20 THEN 1 ELSE NULL END) 
FROM Tickets
  GROUP BY Convert(nvarchar(20),Date,103)

It returns 4 columns per row so we should prepare a 4 column table. I’ve created a new report by choosing Add Report from report selection drop down and named it as Ticket Counts by Peak Hours.

I don’t have enough data to display a better report but it should display ticket counts created between specified hours.

###Adding Totals to Report

To display a summary under table we’ll use another Sql Script.

SELECT 'Totals',
  COUNT(CASE WHEN DATEPART(hour, [Date]) BETWEEN 9 AND 11 THEN 1 ELSE NULL END),
  COUNT(CASE WHEN DATEPART(hour, [Date]) BETWEEN 12 AND 14 THEN 1 ELSE NULL END),
  COUNT(CASE WHEN DATEPART(hour, [Date]) BETWEEN 18 AND 20 THEN 1 ELSE NULL END) 
FROM Tickets

I’ll create a new script. We’ll use a different handle for that script.

… and I’ll update my report as shown here.

Adding > char in front of the row will convert it to a bold row.

3 Likes

#Filtering by Date

Our previous example displays results for all tickets and changing dates does no change on values. To read selected date range we can use {Start} and {End} tags in our SQL Script. I’ll show another example.

select    
    T.TicketNumber,    
    min(convert(nvarchar,T.Date,105)) as Date,    
    min(convert(nvarchar,T.Date,108)) as Time,    
    COALESCE(min(case when TE.EntityTypeId = 1 then TE.EntityName else null end),'-') as [Customer Name],    
    COALESCE(min(case when TE.EntityTypeId = 2 then TE.EntityName else null end),'-') as [Table Name],    
    min(T.TotalAmount) as TotalAmount    
from Tickets as T    
    left outer join TicketEntities as TE on TE.Ticket_Id = T.Id    
Where Date > '{Start}' and Date < '{End}'    
group by T.TicketNumber    
order by Date,Time

This script displays a ticket list. As we’ve included date tags it will display tickets for only selected dates.

I’ll add another report by clicking Add Report from report selection drop down. As this table displays 6 columns per row I’ll create a 6 column table.

As you’ll notice I’ve also set Page Size value in centimeters for better viewing. I hope that will give you enough information to start creating your own reports.

1 Like

##Using Custom Report Tags

Custom reports contains some tags useful for preparing reports easily. These tags works same as Printer Template Tags but the difference is these tags will display values from selected date range, or date range from active work period if used out of report module. We’ll add more tags as needed.

###Supported Tags:

{ACCOUNT TOTAL:X}
This tag returns total balance of X. X can be an account name or account type name. For example if you type {ACCOUNT TOTAL:Cash} it will give you the balance of Cash account. If you type {ACCOUNT TOTAL:Payment Accounts} it will give you the balance total of all Payment Accounts.

{ACCOUNT DEBIT TOTAL:X}
Works like {ACCOUNT TOTAL:X} but it gives only Debit Total.

{ACCOUNT CREDIT TOTAL:X}
Works like {ACCOUNT TOTAL:X} but it gives only Credit Total.

{ACCOUNT TRANSACTION TOTAL:X}
This tag returns total ot X Account Transactions. X should be [Account Transaction Type Name:Account Name]. For example

{ACCOUNT TRANSACTION TOTAL:Payment Transaction:Cash} tag will return total amount of Payment Transactions which changes Cash account.

{ACCOUNT TRANSACTION DEBIT TOTAL:X}
Works like {ACCOUNT TRANSACTION TOTAL} but returns Debit Total.

{ACCOUNT TRANSACTION CREDIT TOTAL:X}
Works like {ACCOUNT TRANSACTION TOTAL} but returns Credit Total.

{ACCOUNT TRANSACTION DETAILS:X}
This special tag prints Account Transaction Details for X Account Transaction Type. X will be the Account Transaction Name. It returns a 3 column table. Date, Description and Amount. For example:

{ACCOUNT TRANSACTION DETAILS:Customer Cash Payment:Cash} tag will print details of cash payments made by customers.
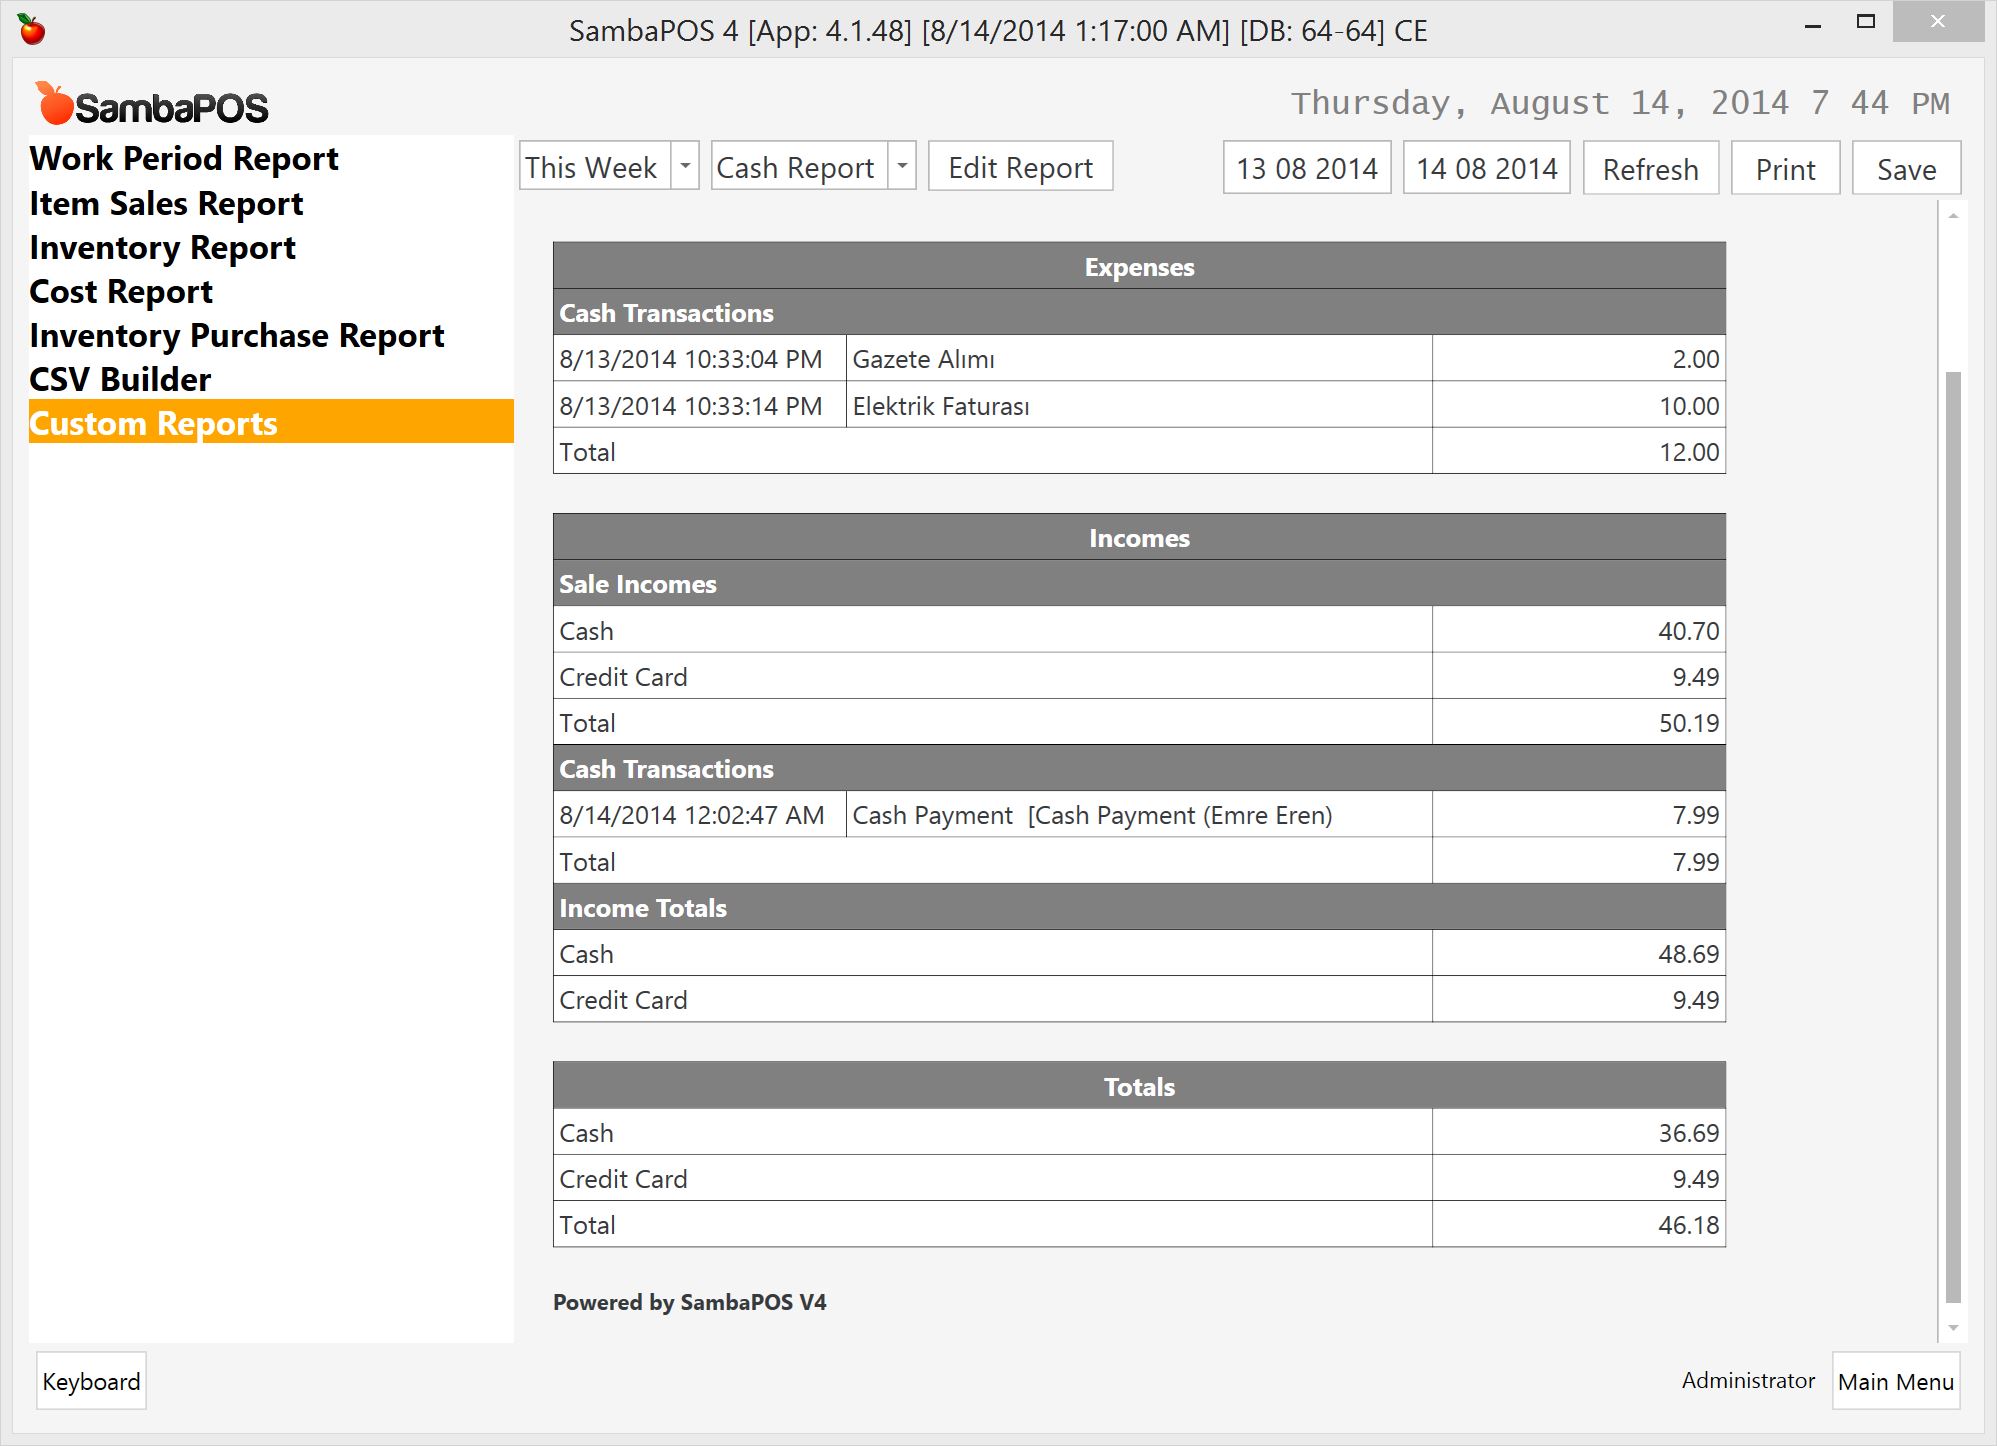
###Sample Report

If you’ve used V2 before you’ll remember Cash Drawer Report. This custom report creates a Cash Drawer Report in that format.

:warning: In this report we assumed you have Cash Expense and Cash Income accounts. Please update income and expense account names in report template to match it to your account and account type names.

[Expenses:1,2,1]
>Cash Transactions||
{ACCOUNT TRANSACTION DETAILS:Cash Expense:Cash}
Total||{ACCOUNT TRANSACTION TOTAL:Cash Expense:Cash}

[Incomes:1,2,1]
>Sale Incomes||
Cash||{ACCOUNT TRANSACTION TOTAL:Payment Transaction:Cash}
Credit Card||{ACCOUNT TRANSACTION TOTAL:Payment Transaction:Credit Card}
Total||{ACCOUNT TRANSACTION TOTAL:Payment Transaction:Payment Accounts}
>Cash Transactions||
{ACCOUNT TRANSACTION DETAILS:Cash Income:Cash}
{ACCOUNT TRANSACTION DETAILS:Customer Cash Payment:Cash}
Total||[=F((TN('{ACCOUNT TRANSACTION TOTAL:Cash Income:Cash}')+TN('{ACCOUNT TRANSACTION TOTAL:Customer Cash Payment:Cash}')),'#,#0.00')]
>Income Totals||
Cash||{ACCOUNT DEBIT TOTAL:Cash}
Credit Card||{ACCOUNT DEBIT TOTAL:Credit Card}

[Totals:3,1]
Cash|{ACCOUNT TOTAL:Cash}
Credit Card|{ACCOUNT TOTAL:Credit Card}
Total|{ACCOUNT TOTAL:Payment Accounts}

This is our result.

5 Likes

This topic is now visible. It will be displayed in topic lists.

1 Like

Absolutely fantastic! Can’t wait to dig in… is it available for installation yet?

In my opinion this is probably the module I was waiting for the most.

Yes it is available. It comes with 4.1.48 and it is an add on module.

1 Like

Can the size of the printout be set? Could i create a report such as an xread that could print out through my receipt printer?

1 Like

How can we do to help you out??

at this moment my paypal account is ZERO… and until BANCO DO BRASIL enables my credit card to work with paypal again,… I am s!#@$!ed…

Thanks!!!

g.

Loving this so far. Now I have no excuse for studying up on my SQL Scripting.

1 Like

Here is an example of how to pull a specific Ticket Type out of your Tickets in a SQL script. I took the example that @emre made and modified it to pull just my Refund Ticket Ticket Type out of all tickets and display just those tickets that are Refund Ticket

Pretty simple just add TicketTypeId = [ID] after Where Follow your insertions with and if you want multiple filters.

select    
        T.TicketNumber,    
        min(convert(nvarchar,T.Date,105)) as Date,    
        min(convert(nvarchar,T.Date,108)) as Time,    
        min(T.TotalAmount) as TotalAmount
    from Tickets as T    
        left outer join TicketEntities as TE on TE.Ticket_Id = T.Id    
    Where TicketTypeId = 6 and Date > '{Start}' and Date  < '{End}'    
    group by T.TicketNumber  
    order by Date,Time

Since you don’t pull any value from TicketEntities table you can simplify that as

  select    
        T.TicketNumber,    
        convert(nvarchar,T.Date,105) as Date,    
        convert(nvarchar,T.Date,108) as Time,    
        T.TotalAmount as TotalAmount
  from Tickets as T
    Where TicketTypeId = 6 and Date > '{Start}' and Date  < '{End}'   
    order by Date,Time
1 Like

Aha your right i missed that thanks

I am not a SQL guru… thats one of the reasons I left programming and went for Team Leader, LOL!!! the other was that JAVA is NOT a language… JAVA is an invention of a tortured mind that wanted all programmers to suffer… have been sayed that…

I am having trouble obtaining data from tables to show my TAXA DE SERVIÇO

here is my SQL so far…

SELECT 
  T.TicketNumber,
  min(convert(nvarchar,T.Date,105)) as Date,    
  min(convert(nvarchar,T.Date,108)) as Time,
  min(TE.EntityName) as TableName,
  min(T.TotalAmount)-min((CASE WHEN AC.Amount IS NULL THEN 0 ELSE AC.Amount END)) as NetoTicket,
  min((CASE WHEN AC.Amount IS NULL THEN 0 ELSE AC.Amount END)) as Taxa,
  min(T.TotalAmount) as TotalTicket

FROM Tickets AS T

LEFT OUTER JOIN TicketEntities as TE on TE.Ticket_Id = T.Id
LEFT OUTER JOIN AccountTransactions as AC on AC.AccountTransactionDocumentId = T.Id AND AC.AccountTransactionTypeId = 8

WHERE Date > '{Start}' and Date < '{End}'

GROUP BY T.TicketNumber

ORDER BY Date,Time

I know this is wrong… Tickets that are supposed to have TAXA DE SERVIÇO do not have and viceversa…

HEEEELLLLPPPPPPP, LOL!!!

Thanks!!!

g.
By the way, just a esthetic issue, nothing that prevents fro using it…

Since it is basically a calculation you an simply prepare something like this.

(I’m adding Tips to report and Id for Tip Template is 3)

SELECT 
  T.TicketNumber,
  min(convert(nvarchar,T.Date,105)) as Date,    
  min(convert(nvarchar,T.Date,108)) as Time,
  sum(case when Cal.CalculationTypeId = 3 then Cal.Amount else 0 end) as Tip,  
  min(T.TotalAmount)-
    sum(case when Cal.CalculationTypeId = 3 then Cal.Amount else 0 end) as NetTicket,
  min(T.TotalAmount) as TotalTicket

FROM Tickets AS T
LEFT OUTER JOIN Calculations as Cal on Cal.TicketId = T.Id

WHERE Date > '{Start}' and Date < '{End}'
GROUP BY T.TicketNumber
ORDER BY Date,Time 

I’ve removed table name for simplicity you can merge it with previous script.

1 Like

Thanks!!!

THANKS!!! I GOT IT WORKING!!!

THANKS AGAIN!!!

G.

PD, @Emre, sorry to bother you so much… I was wondering if there is any table in wich I can get the actual stock or is there ayn way to calculate it, so i can put toghether a report.

THANKS AGAIN!!!

I’ve been waiting for this :D. I’m now downloading and installing SQL server on my personal laptop so that I could test this feature out despite being on a long holiday leave LOL!

You can access stock level for last closed work period from PeriodicConsumption table but we calculate actual levels on the fly so we store it nowhere.