Hello, i have already established everything. things are working great.
the owners asked for a P & L report. so i installed the custom report module. and i dont know how to do it…
i have a server SQL database . can it be done through tags ? or it cant be done at all ?
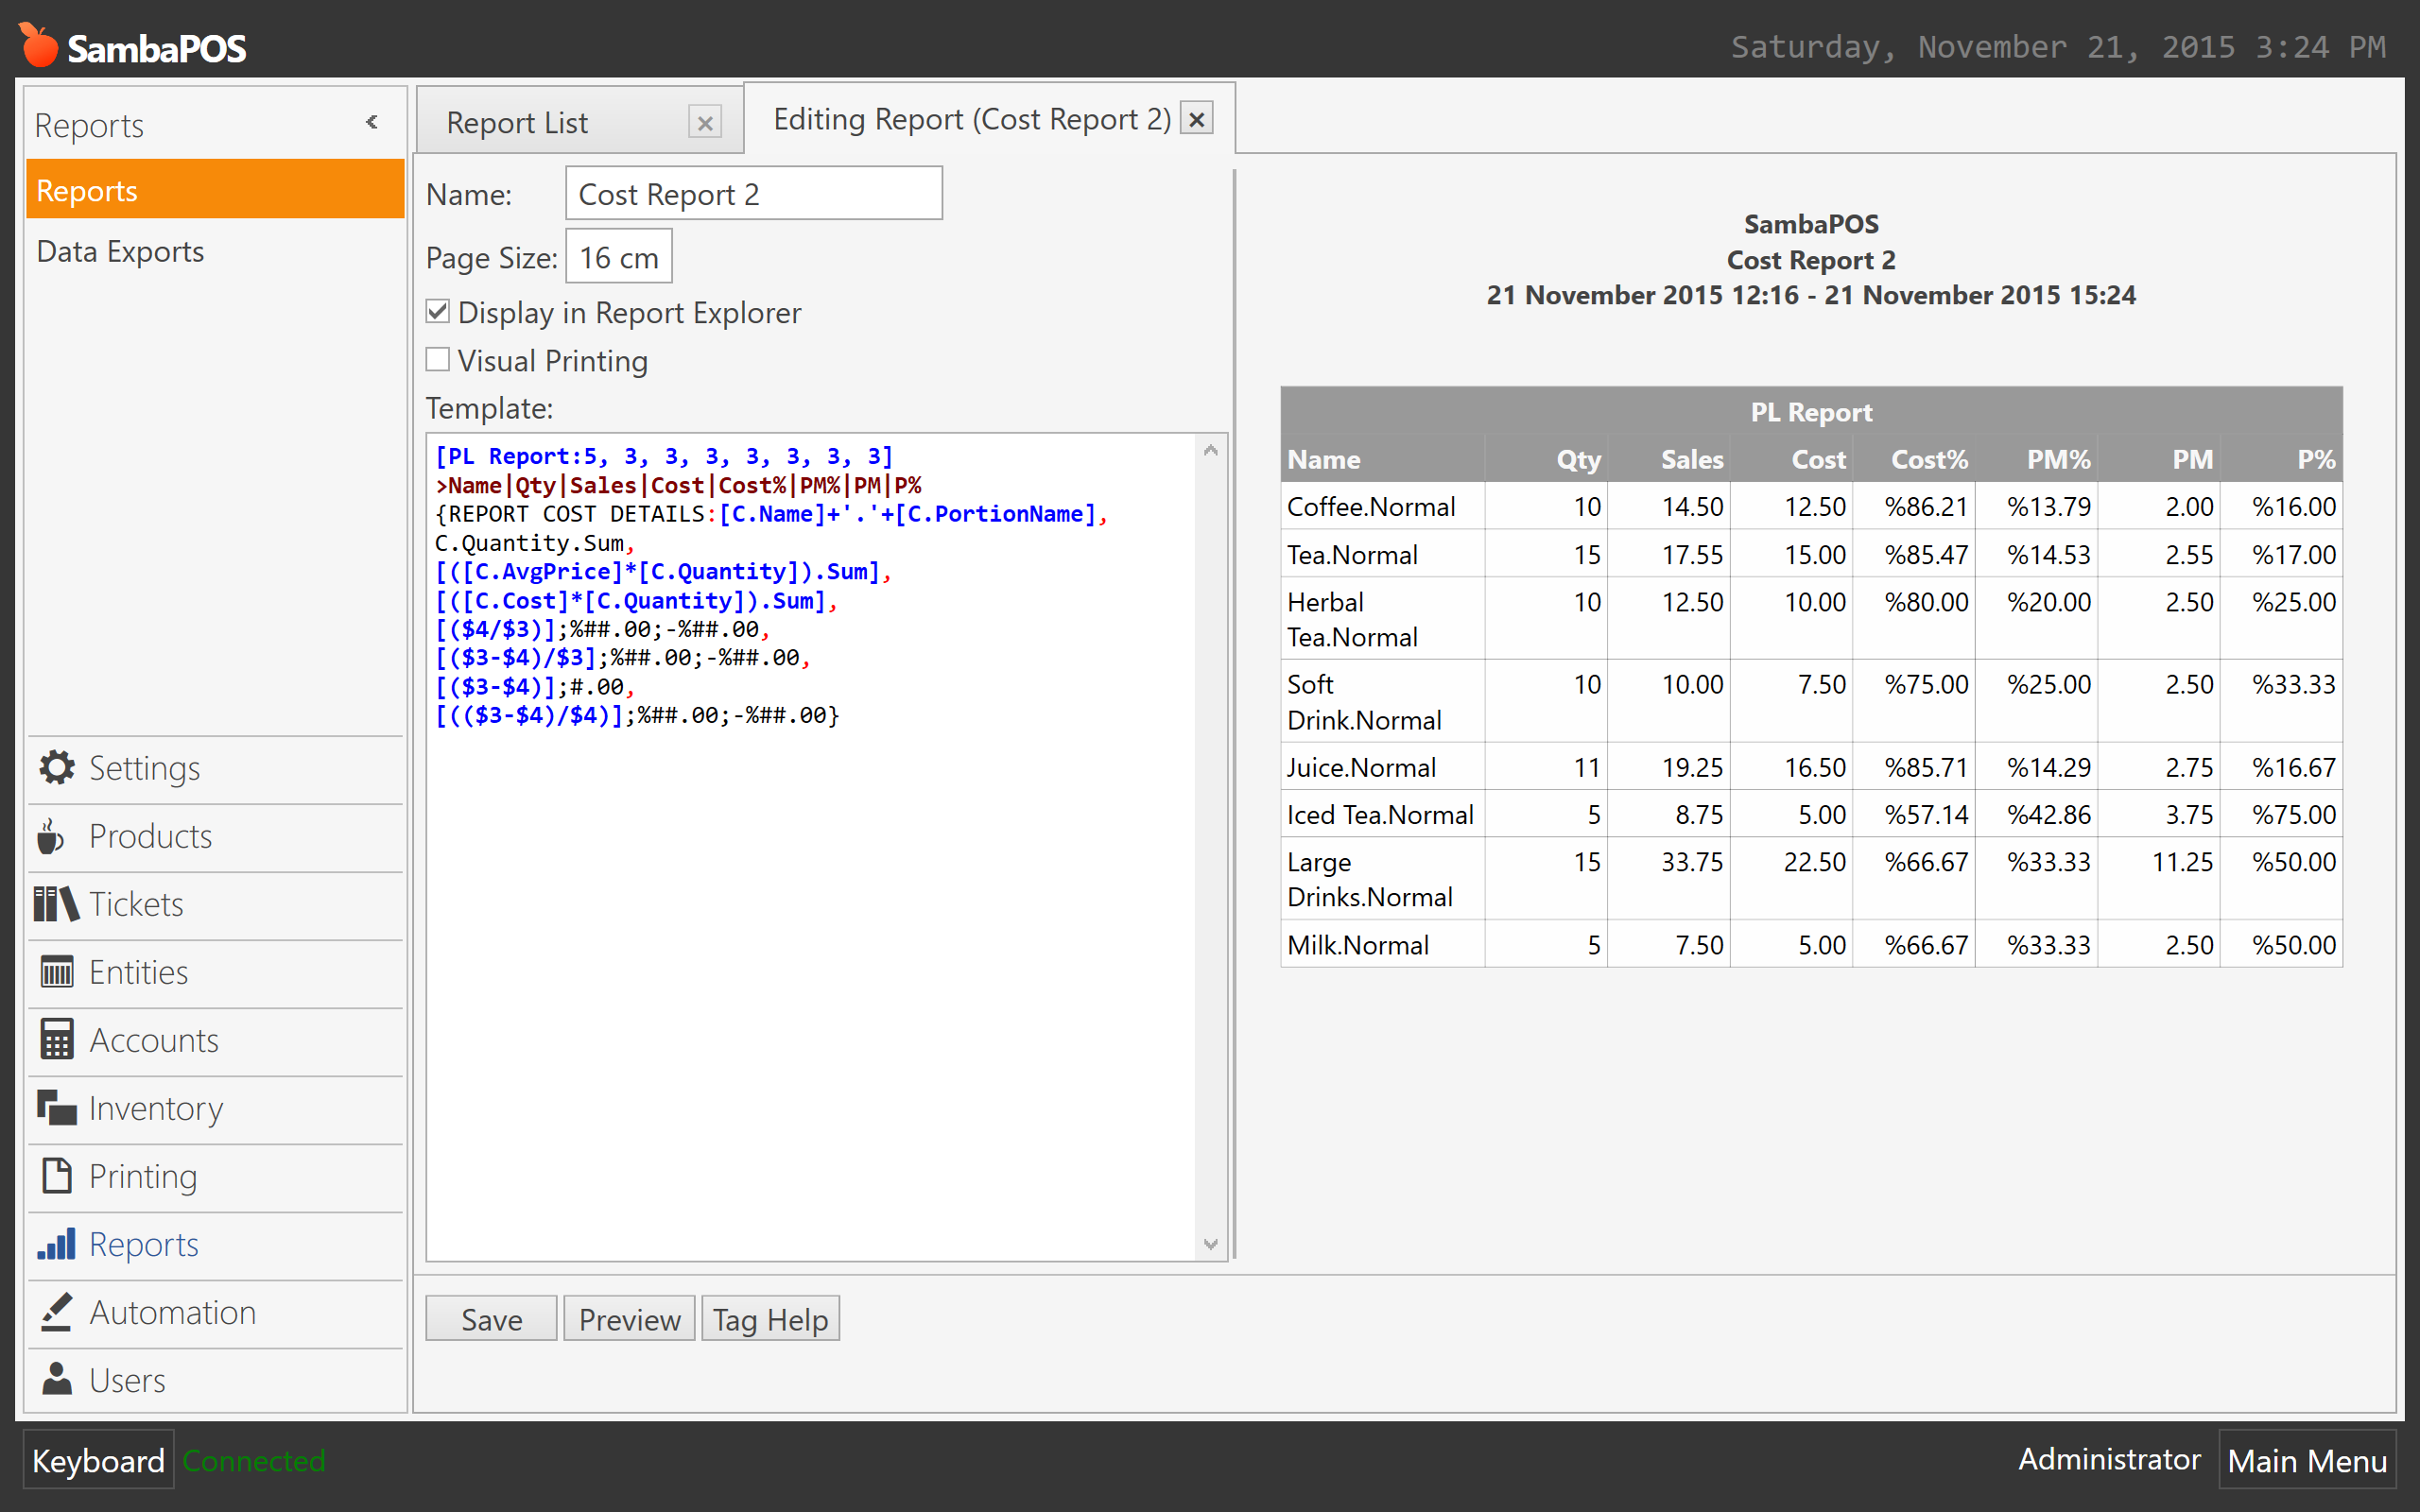
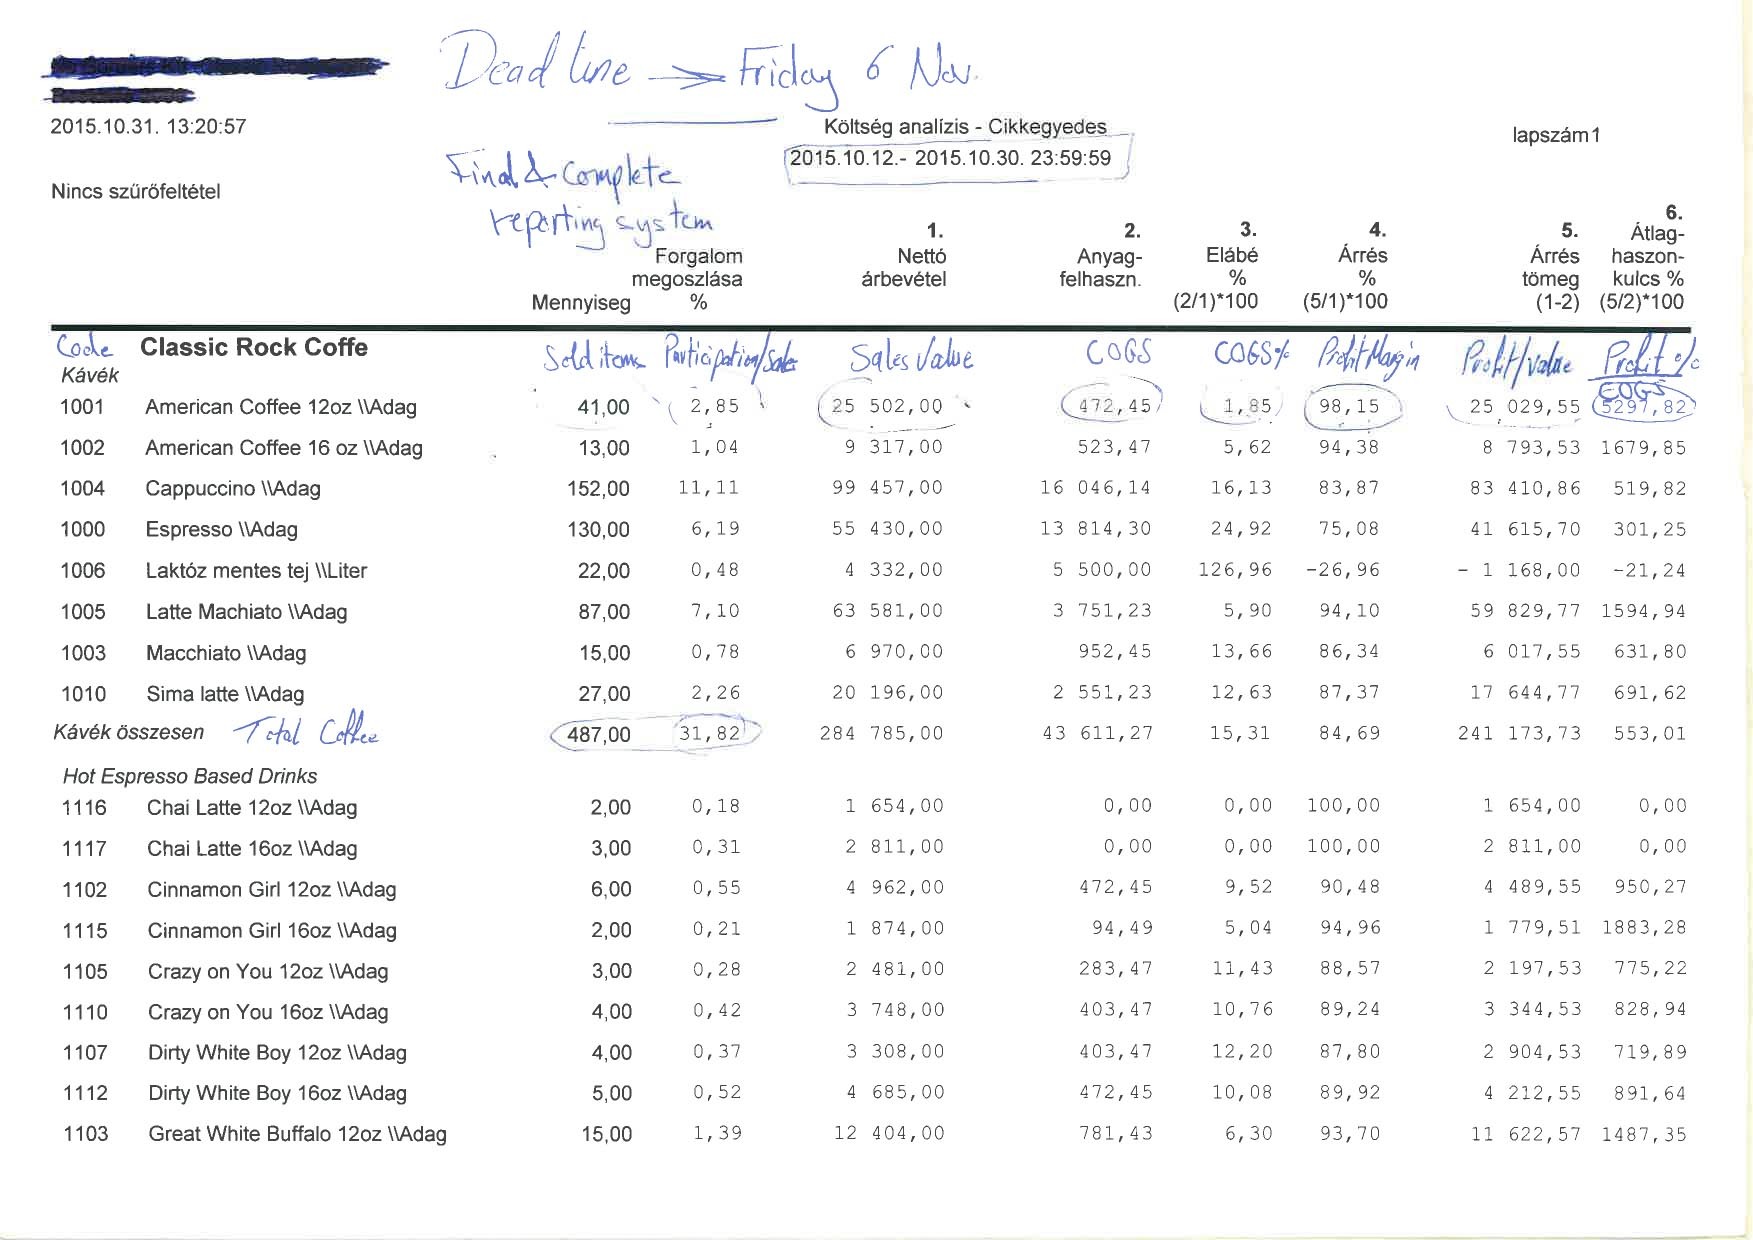
the P&L report they want to show
Item name , Sold items , participation sales , Sales Value , COGS , COGS% , Profit Margin , Profit Value , Profit % Cogs.
I don’t think this is actually a P&L report as P&L would typically show overheads/non COG expenses etc. to show your overall bottom line but either way.
Something like this should be achievable but don’t expect it to be a simple one line report tag.
PLU (not required for samba)
Product Name (self explanatory) = Menu Item Name
QTY Sold (self explanatory) = Total Product QTY
Participation Sales = % of Qty Sold (looks like qty sold % not value) = (Total Product QTY / Total Orders QTY)
Sales Value (self explanatory) = Product Sales Total
Cost of Goods (self explanatory) = Product Cost Total
Cost of Goods % = (Product Cost Total / Product Sales Total) x 100
Profit Margin % = ((Product Sales Total - Product Cost Total) / Product Sales Total) x 100
Profit Value = Product Profit Total ( Product Sales Total - Product Cost Total )
Profit % Cost of Goods = Return on Investment ( Profit / Product Cost Total ) x 100
OK, think that’s about right, the number formatting threw me a little for a minute but that should be right.
We can configure it to show anything as long as we know how we are getting the numbers.
I mean a PNL is subbjective and depends on how the owner wants it calculated. Explain what should be included for each column and what should be calculated to get it. If you want to include expenses them we need to know how they are being recorded etc.
Thank you so much…
Would that be enough for you ? Or you need me to dig up more info. I can ask the Accountant.
Product Name (self explanatory) = Menu Item Name
QTY Sold (self explanatory) = Total Product QTY
Participation Sales = % of Qty Sold (looks like qty sold % not value) = (Total Product QTY / Total Orders QTY)
Sales Value (self explanatory) = Product Sales Total
Cost of Goods (self explanatory) = Product Cost Total
Cost of Goods % = (Product Cost Total / Product Sales Total) x 100
Profit Margin % = ((Product Sales Total - Product Cost Total) / Product Sales Total) x 100
Profit Value = Product Profit Total ( Product Sales Total - Product Cost Total )
Profit % Cost of Goods = Return on Investment ( Profit / Product Cost Total ) x 100
Thanks in advance. I don’t understand much of accounting. So forgive me.
I just took a look at a V4 installation and I do not see any Inventory Report Tags. They were introduced in V5. You need the Inventory Tags to be able to track Consumption and Cost and then Profit Rate.
It could be doable using SQL in V4, but I am not going to attempt that. What we have already available in V5 works very well.
thank you so much… thanx a million. i will show this to the owners and will buy V5 deff…
but the Q is… will i be able to import my database SQL server V4 to V5 ? with no problems ??
I believe it is the % of units sold of a product from total qty of all products sold.
Similar to the % value for product group on work period but by qty rather than value.
Ie 100 x £1 coffees would give higher % than 4 x £25 steaks.
In an example if sales for a period were;
100 x Coffee £1 = Total Product Sales @ £100
4x Steak £25 = Total Product Sales @ £100
50 x Beer £4 = Total Product Sales @ £200
The sales % as on work period would show;
Coffee = £100 = 25%
Steak = £100 = 25%
Beer = £200 = 50%
Total Sales = £400 (100%)
The participation sales would be based on QTY giving these results;
Coffee = x100 = 64.9%
Steak = x4 = 2.6%
Beer = x50 = 32.5%
Total QTY= x154 (100%)
 im trying my best but im not a pro. and thank you for your reply