Custom Report Tags in detail

… Data > Fields > Date > Group Interval = Date
… View Options > Unselect these values

  • Show Column Headers
  • Show Data Headers
  • Show Filter Headers
  • Show Row Headers
  • Show Column Grand Total Header

Review Data > Fields and adjust widths.

Feel free to play with other settings to make it better for your taste :slight_smile:

If something goes wrong delete layout file and start from beginning. We’ll store layouts on database on next releases but for now you can find it under
[My Documents]\SambaPOS4\Layout\PG_[Report Name]_[Table Name].xml

1 Like

Dear @Emre, I got another error…


in

[Ventas (TAGS):1,2,2,2, 2, 2, 2, 3]
>Ticket|Fecha|Hora|Mesa|Neto Ticket|Taxa Serviço|Descuento|Total Ticket
{REPORT TICKET DETAILS:T.TicketNumber,T.Date,T.Time,EN.Tables Pizzaria,=[T.TotalAmount]-[CA.Taxa Serviço]-[CA.Desconto],CA.Taxa Serviço,CA.Desconto,T.TotalAmount}
>Tickets: {REPORT TICKET COUNT}||||NETO|{REPORT CALCULATION TOTAL:(CT=Taxa Serviço)}|{REPORT CALCULATION TOTAL:(CT=Desconto)}|{REPORT TICKET TOTAL}

Thanks!!!

G.

Dear @emre, seems I cant get a grip on pivot reports… have been trying withou luck, can you help me out here??

this is my report:

[!Comisiones Pivot:2,2,2, 2, 2, 2]
>Fecha|Garçon|[N]Pessoas|[C]Desconto|[C]Comisiones|[C]Total
{REPORT TICKET DETAILS:T.Date,TT.Garçon Pizzaria,TT.Pessoas,CA.Desconto,CA.Taxa Serviço,T.TotalAmount}

I have dragged:
Fecha and Garçon to ROWS
resto of the fields to Columns

this is what I get:

Thanks!!!

G.

@gerlandog I’ve uploaded a new setup to solve that error. Please let me know if it solves it or not.

For the pivot table question I can help better if you can tell us what kind of a report you need.

YES!!!

would like a report that shows date by date, waiter by waiter (graçon) the fields TT.Pessoas,CA.Desconto,CA.Taxa Serviço,T.TotalAmount

Thanks!!!

G.

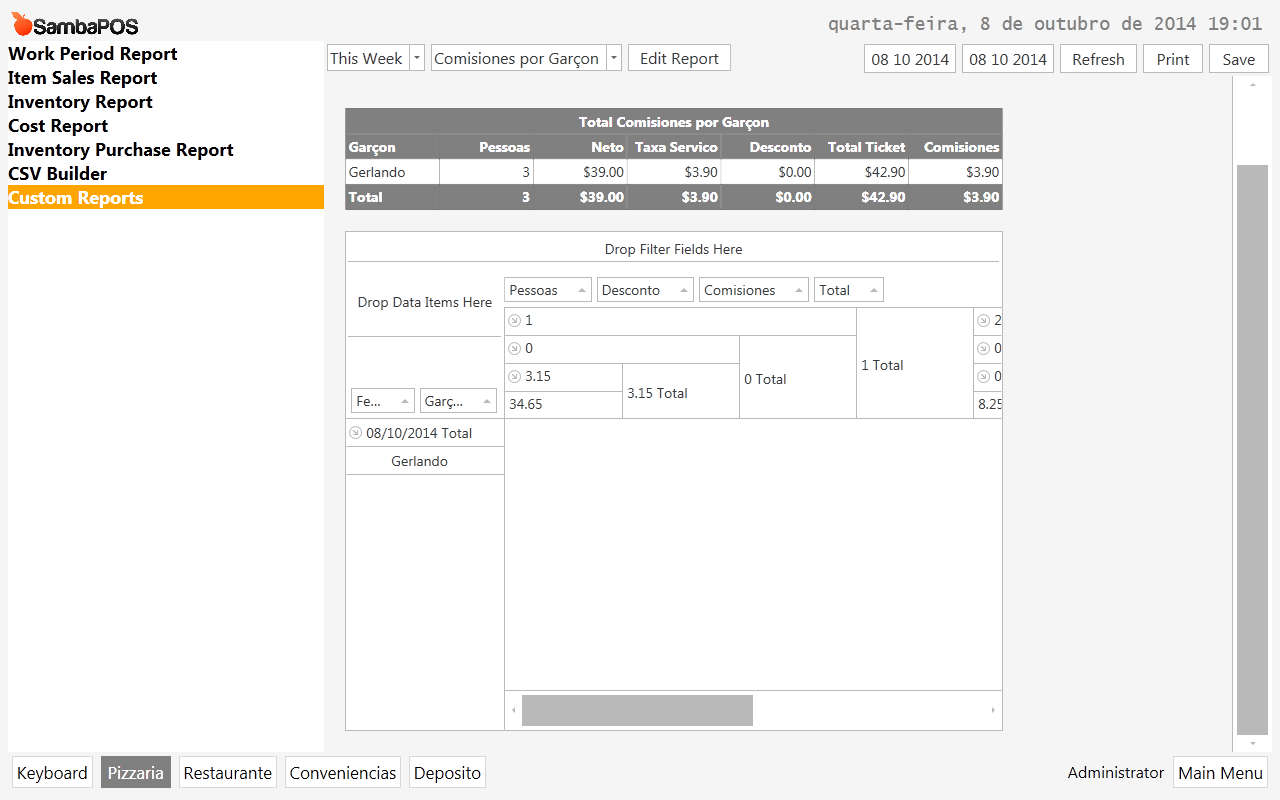
@gerlandog as I can see from your screen shot you are adding your data to columns. You can try adding them to data area (inside control). Think it as a 3D (cube) grid. Rows will be date, columns will be waiters and numeric data will be inside grid.

@emre how would I format rounding for L.Hours field value? I tried LN.Hours it did not work. I would like for it to round hours to just 00.00

Do you need full hours? how do you want to round 1 hr 25 min ?

Preferably I would like to show like this…

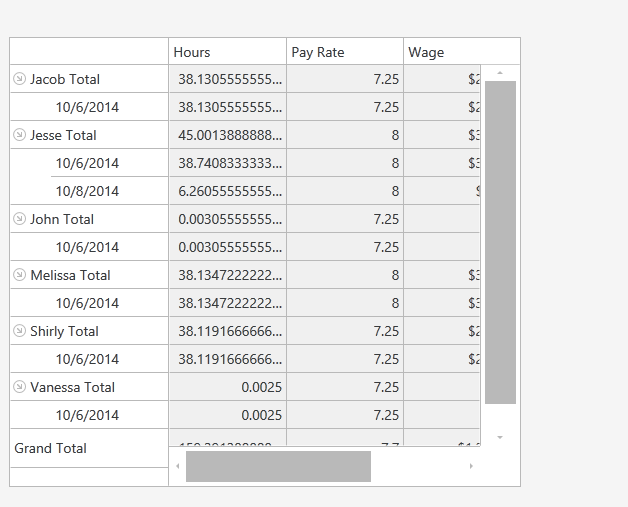
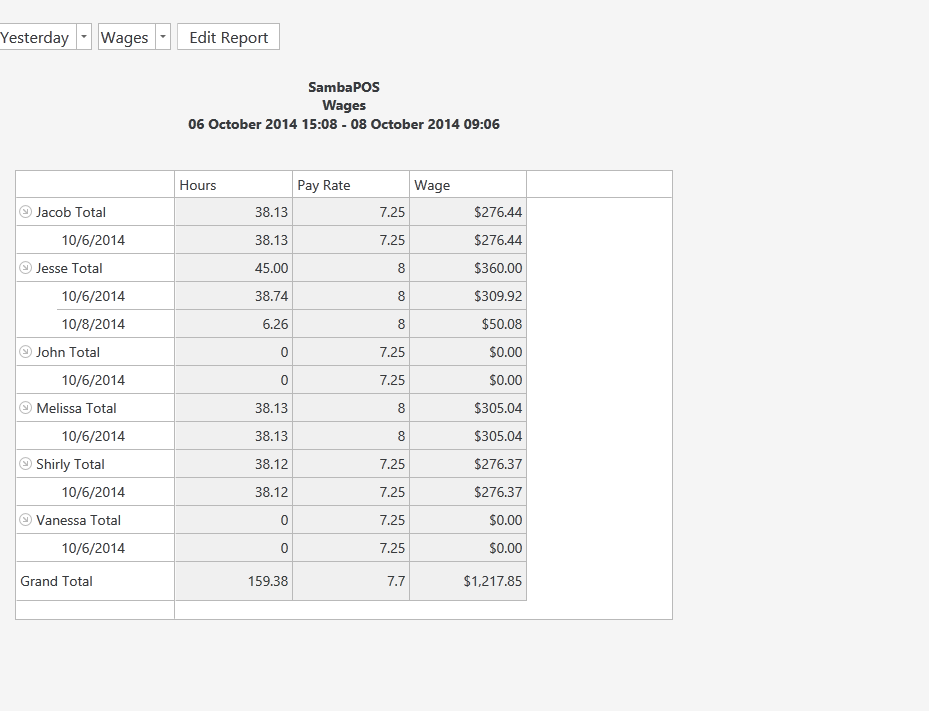
IF its 1 hour 15 min it would show 1.25 If its 1 hour 30 min it would show 1.50 If its 18 hours 15 min its 18.25 and so on. I am using easy numbers for reference…

Doesn’t it already does that? How it displays it?

Or can I set that in the Design Mode?

Yes you can do it by changing Data > Fields > Hours > Cell Format = #.##

But it does not change calculation. If you want to calculate it on rounded values ,=F([L.Hours]) should correctly round that.

1 Like

ah so its =F([field]) I was trying =F(field) that worked great… thank you.

… also you can set field widths in design mode.

Oh I plan to mess with it all… I even want to change the colors i saw that in there too. Now I need to fix a few things. I do not want it to show total by the entity name… I think thats a design mode setting too.

View Options > Row Total Location = Far
View Options > Show Row Totals = False

1 Like

This thing is complicated… but I like that… HOLY cow you can do some cool things with Pivot tables. I have some ideas I want to try.

Yes design mode is not for users but I’ve published everything to be able to understand what features will be used. I’ll slowly create field context menus to access these settings easily.

1 Like

Playing with colors now and its quite fun…