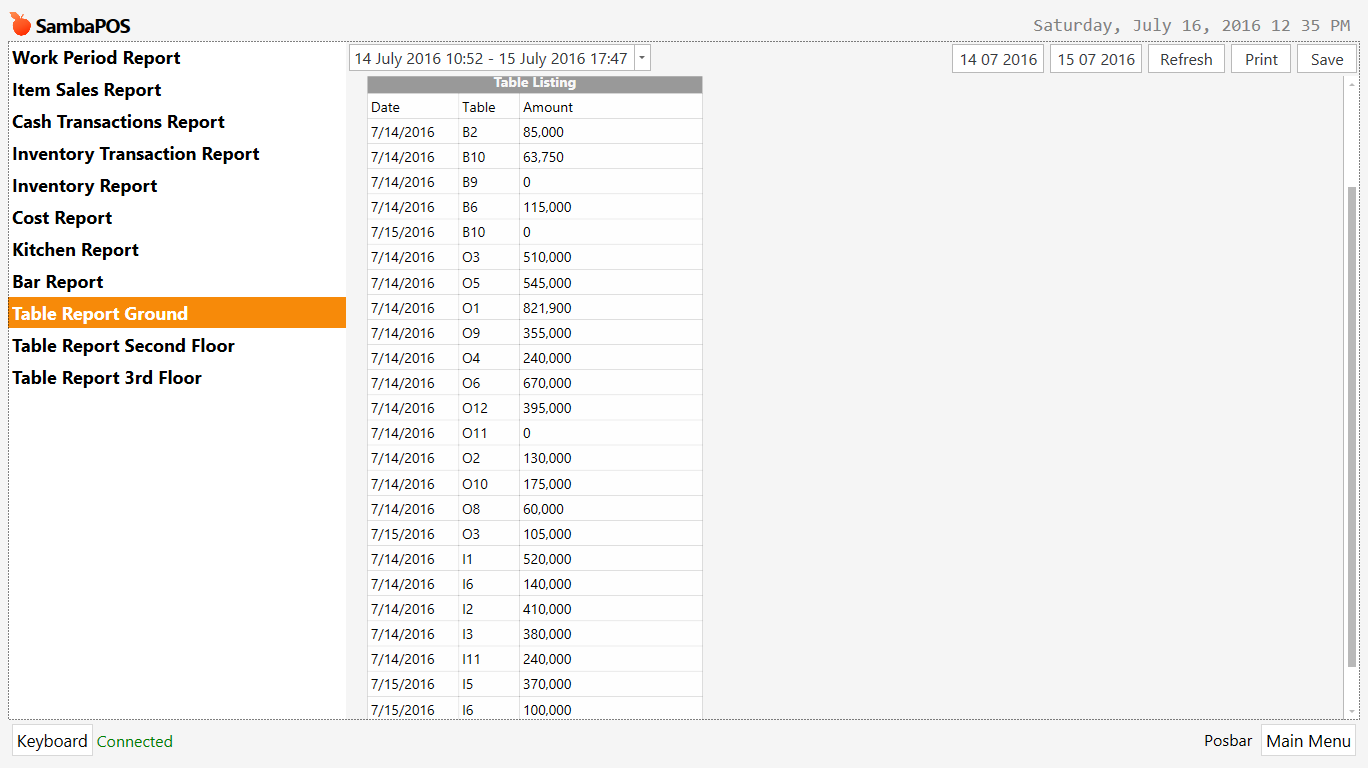
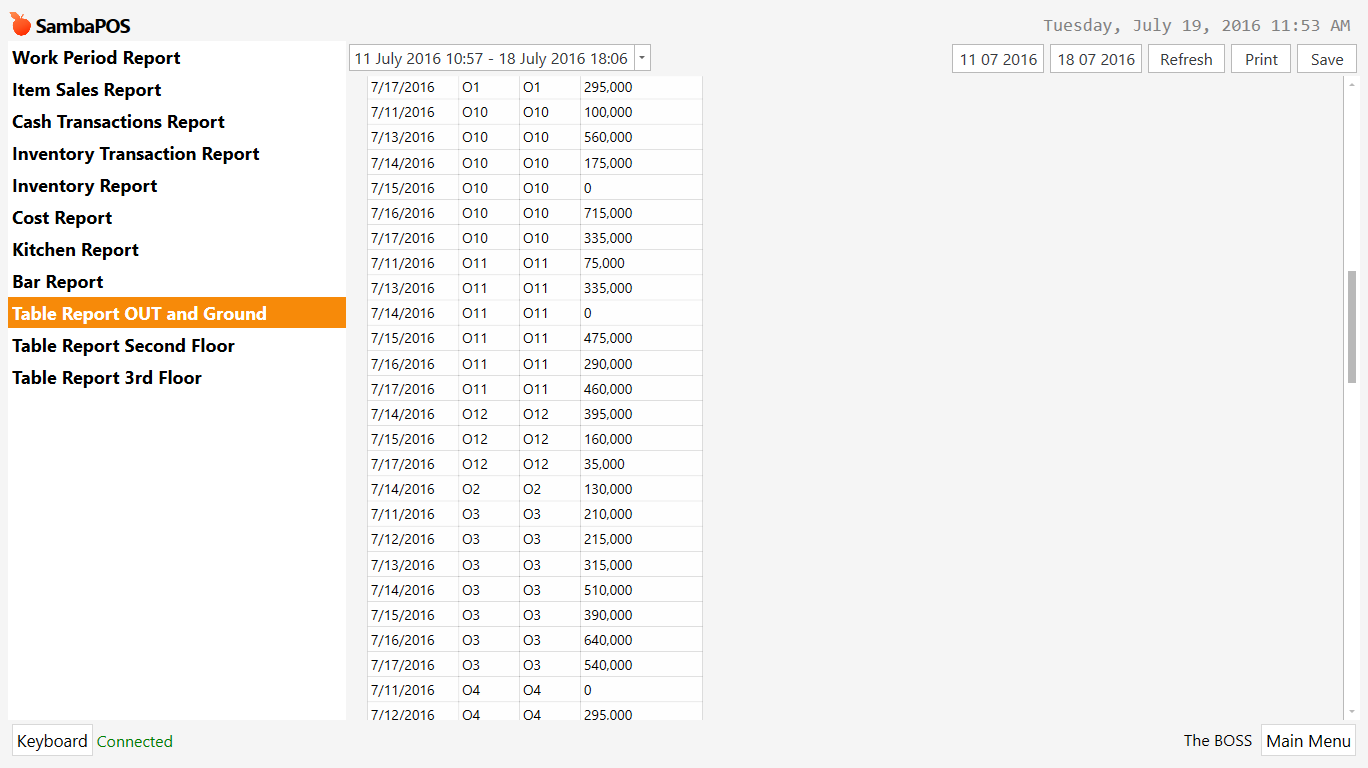
I do with following script, for ALL Tables start with “O” or “I” or “B” (which is my groundfloor area Bar, Outside and Inside)
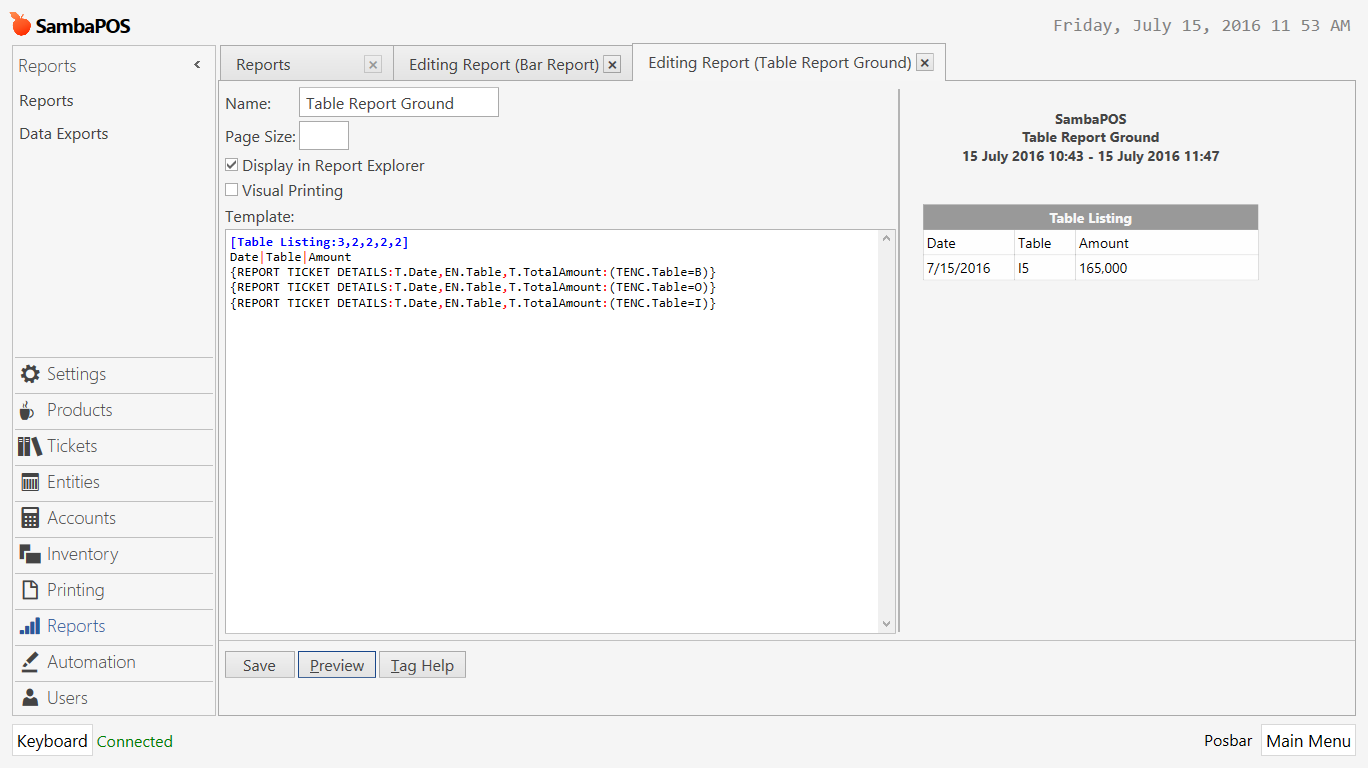
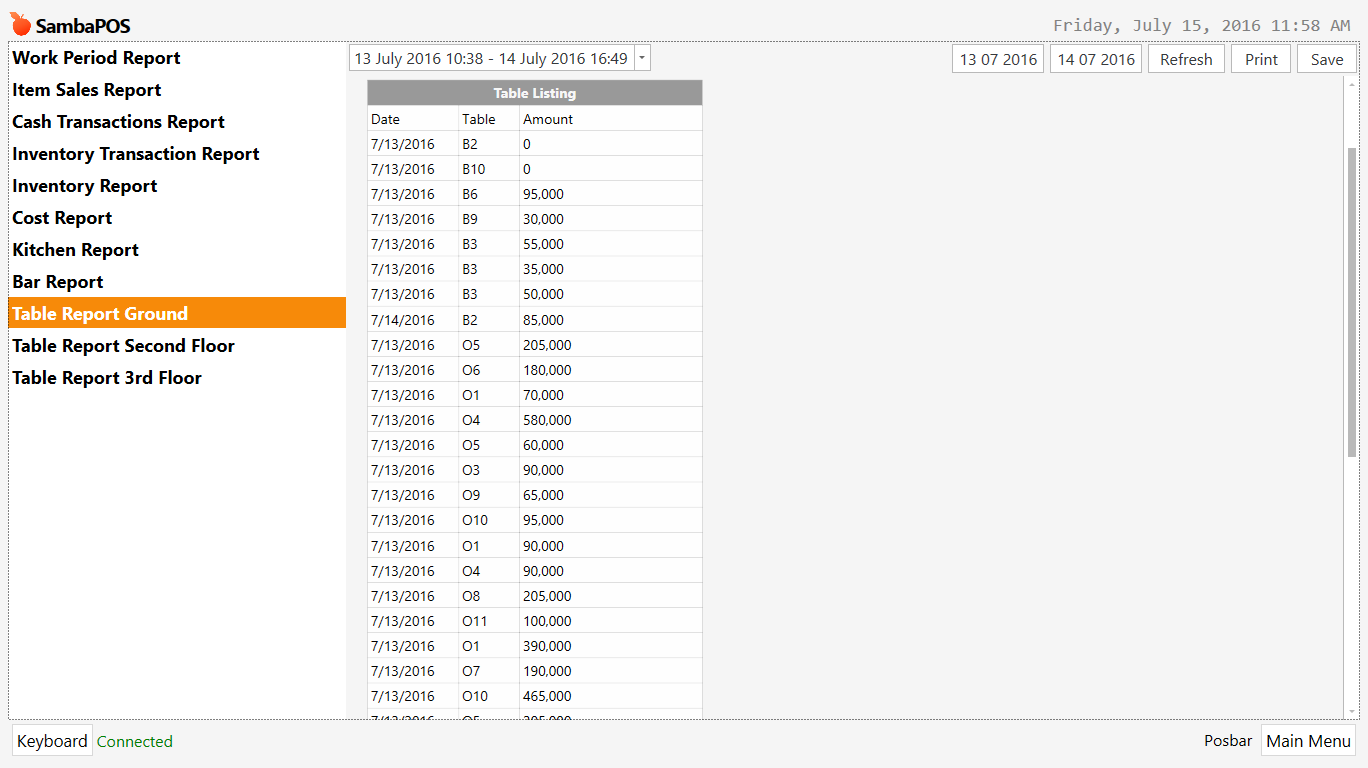
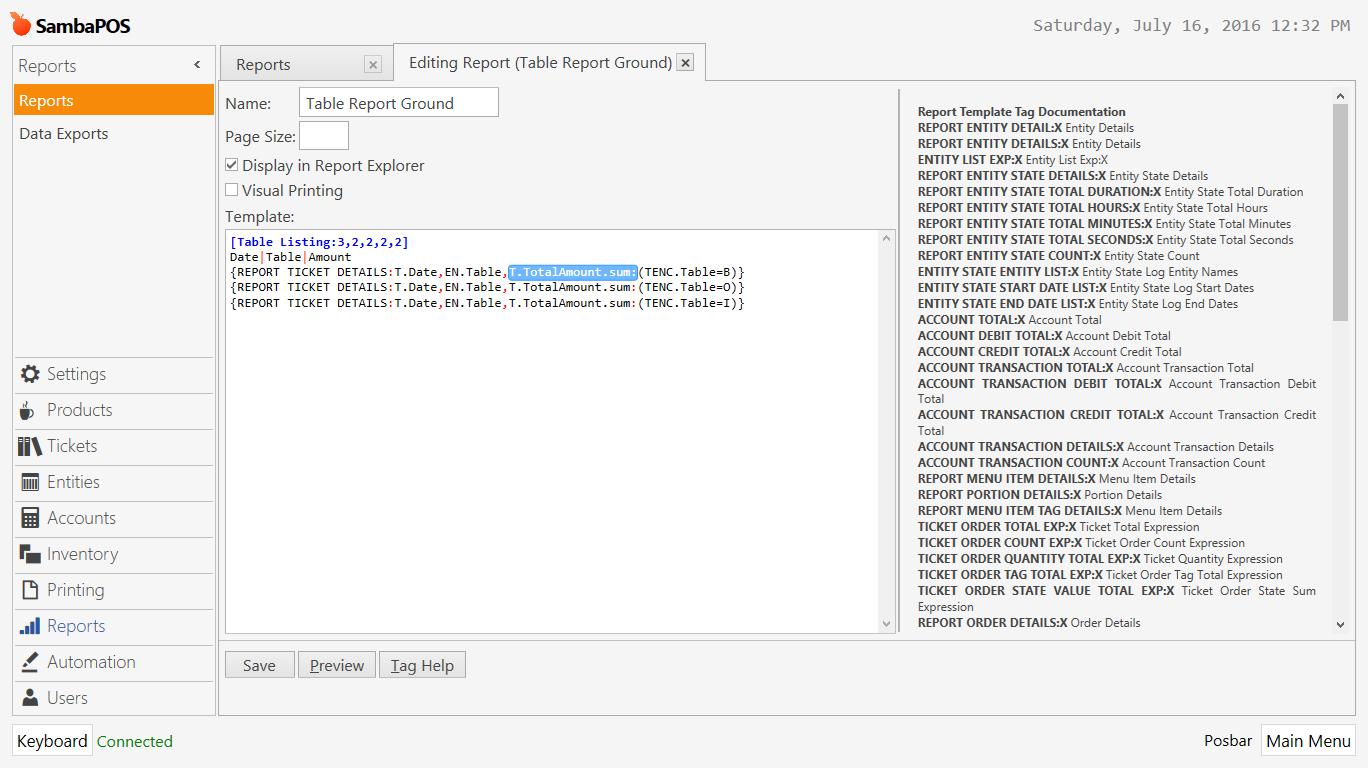
[Table Listing:3,2,2,2,2]
Date|Table|Amount
{REPORT TICKET DETAILS:T.Date,EN.Table,EN.Table.asc,T.TotalAmount.sum:(TENC.Table=B)}
{REPORT TICKET DETAILS:T.Date,EN.Table,EN.Table.asc,T.TotalAmount.sum:(TENC.Table=O)}
{REPORT TICKET DETAILS:T.Date,EN.Table,EN.Table.asc,T.TotalAmount.sum:(TENC.Table=I)}
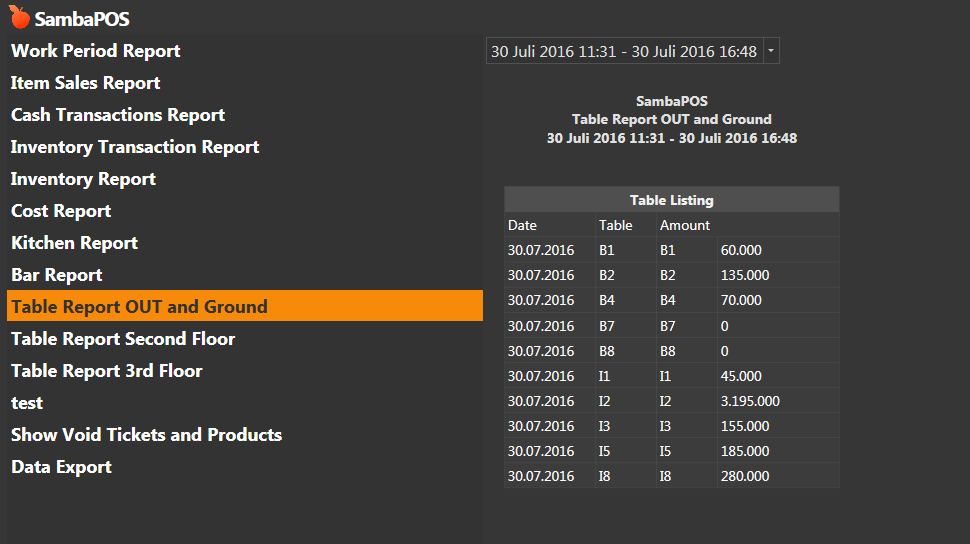
Or you must put YOUR Table names exactly inside the script like…
[Table Listing:3,2,2,2,2]
Date|Table|Amount
{REPORT TICKET DETAILS:T.Date,EN.Table,EN.Table.asc,T.TotalAmount:(TENC.Table=Bill)}
{REPORT TICKET DETAILS:T.Date,EN.Table,EN.Table.asc,T.TotalAmount:(TENC.Table=31)}
{REPORT TICKET DETAILS:T.Date,EN.Table,EN.Table.asc,T.TotalAmount:(TENC.Table=32)}
{REPORT TICKET DETAILS:T.Date,EN.Table,EN.Table.asc,T.TotalAmount:(TENC.Table=33)}
{REPORT TICKET DETAILS:T.Date,EN.Table,EN.Table.asc,T.TotalAmount:(TENC.Table=34)}
{REPORT TICKET DETAILS:T.Date,EN.Table,EN.Table.asc,T.TotalAmount:(TENC.Table=35)}
{REPORT TICKET DETAILS:T.Date,EN.Table,EN.Table.asc,T.TotalAmount:(TENC.Table=Sofa)}
{REPORT TICKET DETAILS:T.Date,EN.Table,EN.Table.asc,T.TotalAmount:(TENC.Table=Apa)}
{REPORT TICKET DETAILS:T.Date,EN.Table,EN.Tble.asc,T.TotalAmount:(TENC.Table=Office)}
With copy-paste is a question of minutes to do and give you nice results.
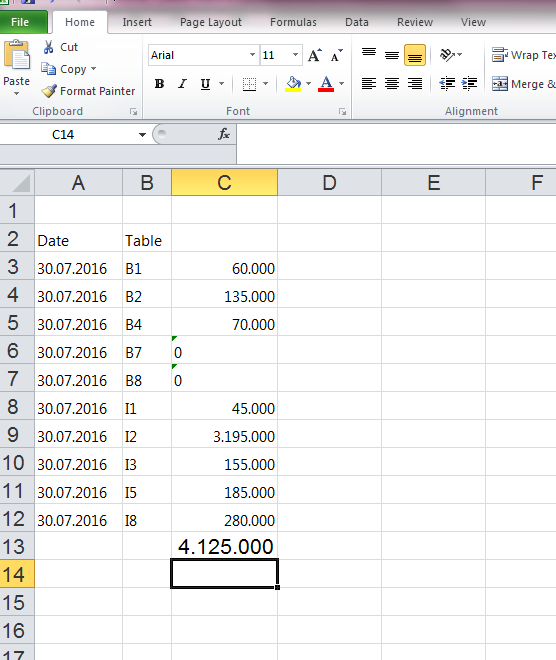
After That I save report in xps, and use a third Party program (“Able2Extract 7.0”) to export to Excel (see my other post here)
and get the GRAND TOTAL ease, also in Excel I am able filter, sum, group etc tables revenues and statistics
Is a bit tricky and many small details to find out, but its worth to try …


 any Idea?


 I also just copy the script from other forum, so I dont mind the detail, when I import ito Excel, I simple Skip the column, lol