Hello,
We use Sambapos in our Small Deli/Grocery Store. I need a way to search a products history. IE Date of last Sale, Total number of sales and Total Amount of sales. The product will change every time the report is ran. Example Manager is looking for product history on Dole Pineapple Juice. So they Type in Dole Pineapple Juice and the report generates all the sales data for that item. How can i implement this?
A very simple way to do this is to use the Customer Report Viewer widget and Editor widget. You would type in the item name to the Editor Widget and pass it to your custom report for all the data points above you explained.
Heres a really rough quick screenshot of a report which has total work period sales by user and I typed my username into the Editor Widget. I’m sure there are ways to enhance this concept.

You can set a predetermined report period for your date like (Report Name:Last Month) or if you want to have a custom date range you can find solutions to this on the forum.
Would something in this style work for you? I am thinking the left side (customers in the animation) would be Menu Items and the right side would be the Orders Report.
(If the animation is not playing, click the image for the animation to run in a pop-up)
I have some free time coming up in the next few weeks, I can help develop something.
 @ your customer list
Yes, something like that would work, but I need it to be Department Specific. For Example. Non Tax Grocery is the Group Code, select date range, then it generates a report of the items that sold from that group code, the number of items sold, and the total sales. Also, if I want to see how many Pepsi Bottles I sold, I could search by that name and date range and it will tell me how many we sold.
I can make something up…but it will not be a few months. I am at the top of our busy season. When things slow down I can whip something up.
Picking the inventory item will look something like the animation in this post. (The Vendors or Adding Items to the shopping list buttons would not part of the screen.)
In the mean time, if other people of the forum have any input of report ideas, please feel free to post them.
After thinking about this over the weekend, I think maybe Pivot Table Report might be the way to go. Below is a simple one I use:
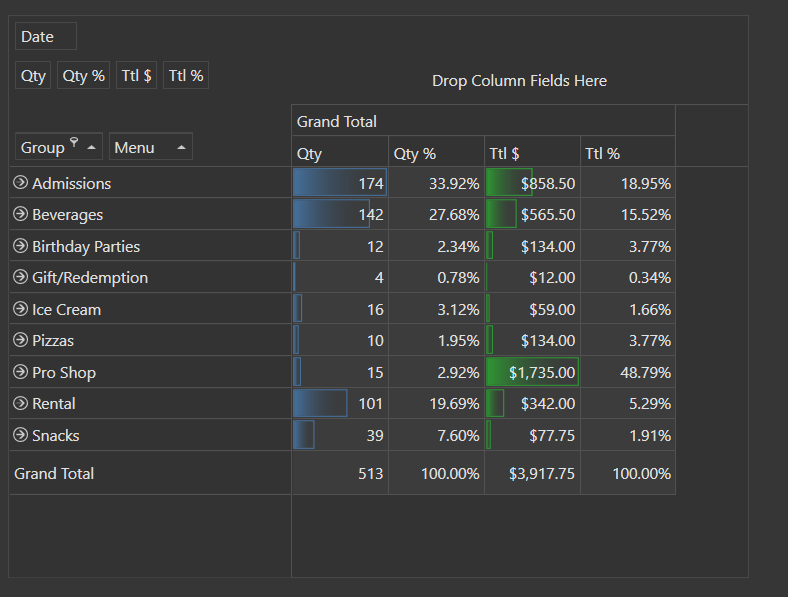
This is showing a totals for the Group Code. The blue and green graphs (conditional formatting) are just visual indicator of their rank based on the numbers in the column
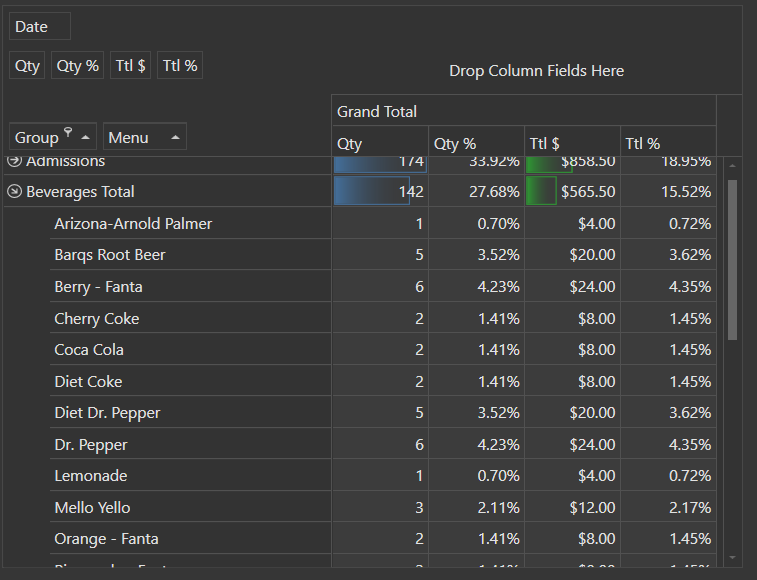
This is an expanded Group Code showing the menu items. No conditional formatting, but one could be applied.
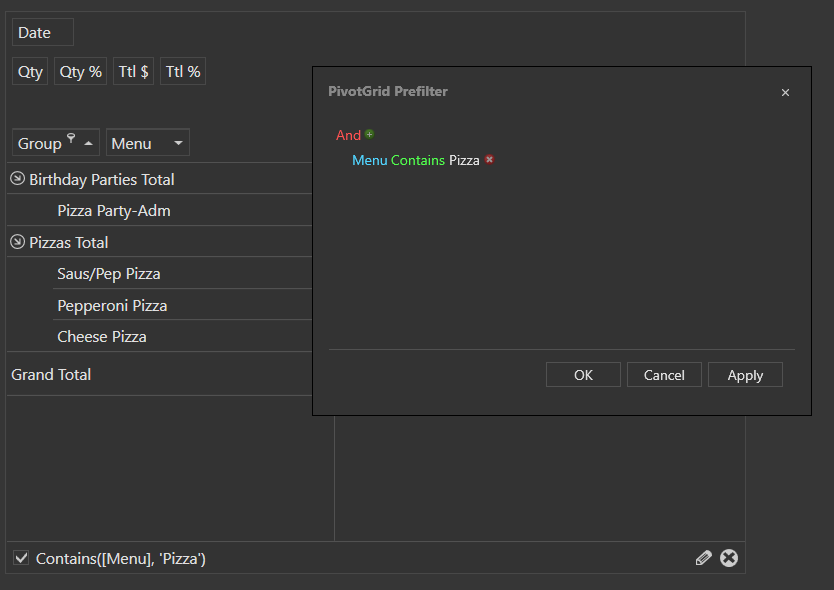
A pre-filter can be applied to search or narrow down items for viewing. Here I am just searching for
Pizza in any Group Code. A Group Code Pre-Filter could be applied to narrow down a selection.
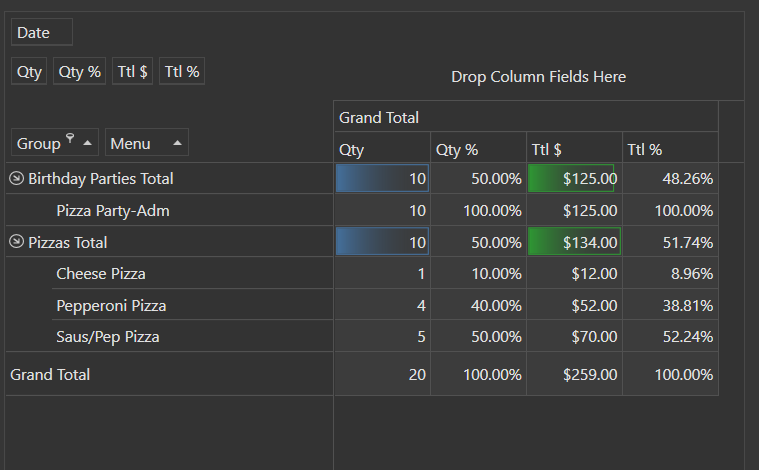
Notice the graphs, Group totals and the Colum percentages have automatically changed.
What I had in mind before was creating another entity screen with a report listing all your menu items on one half the screen then another report on the other half of the screen. You would only be able to select one item at a time to run a report.
Using a Pivot Table Report just involves creating a report and setting up the columns and rows. And applying any conditional formatting, If you wanted. The Pivot Table Report is ran in the Reports Section of Sambapos.
Let me know if you like this idea. It would quicker for me to show than my first idea.
Sorry it took me so long to get back, been so busy lately. Yes, I love this idea. Where can I find more information, please and thank you.
Most of the information on how to setup a pivot table report can be found here:
https://kb.sambapos.com/en/9-1-6-custom-report-pivot-table-views/
This is the report I used for a pivot table report:
Page Size: 700
[!Orders Report:1,1,1,1,1,1,1]
>Group|Menu|[D]Date|[N]Qty|[N]Qty %|[C]Ttl $|[C]Ttl %
{REPORT ORDER DETAILS:O.ItemGroup,O.MenuItemName,O.Date,O.Quantity,O.TotalPrice:(ODI=True) && (TY=Ticket):{0}|{1}|{2}|{3}|{3}|{4}|{4}}

A pivot table report starts out the same as an ordinary report. The only difference you ad an ! in front of the table name.
Columns that contain numbers will need to define the value type. This is done by adding a special tag in front of the column headers
-
[C]- Currency -
[N]- Number -
[D]- Date
You will also notice on my report I only define 5 fields in the report but have 7 columns. We will get to that later.
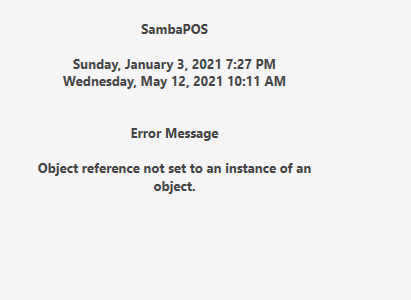
To view the report, you will need to save the report, then re-open it.
 If you do not save, you will get an Error Message Object reference not set to an instance of an object.
After saving and opening up the report, you will get a basic view of the pivot table.
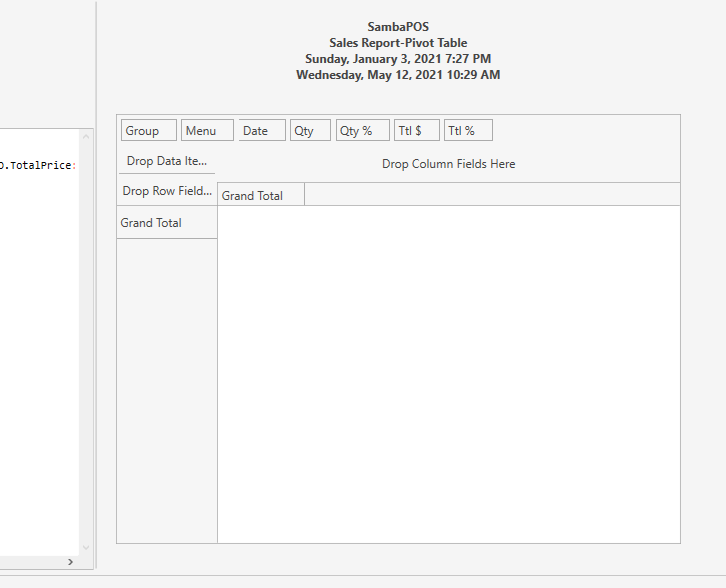
If you are seeing as the above screen, we can save/close this report and head over to Reports screen on the main menu.
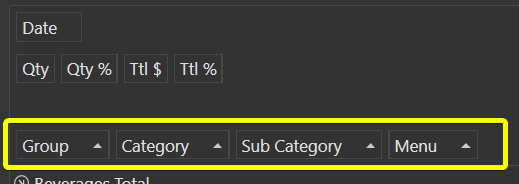
Find the report and run it, you will notice that not data is present. Lets fix that. Click/hold and drag the Group button to the Drop Row Field Here section. Then Click/hold and drag the Menu button behind the Group button. You will notice the report is starting show some information. If you need to adjust the dates to have information appear you can do that. You will need to repeat the above steps.
Next we are going to add some columns to our report. Click/hold the Qty button and drag that to the Drop Data Items Here section. Do that same to Qty %, Ttl $ & Ttl % buttons. You man notice as you drag buttons to this section, they disappear and the text “Data Headers” appear. Hovering your mouse or dragging items over the text will cause a popup to appear with the buttons visible.

If the overall look of the report looks like the way you like it (the % columns are wrong-we will fix it next), we will need to save it. To save it right click anywhere within the report section and choose Save Changes on the popup. If you do not save changes, every time you run the report you will need to set the rows and columns. (the Date button is currently not used, we will use it later)
Next we will fix the % columns. Right click within the report again and choose Design Mode. On the popup, expand Data->Fields->[4], look for the row labeled SummaryDisplayType change Default to Percent of Column. Do the same for Ttl % column ( [6] ).

At this point you can “Save Changes” and experiment with different settings in the Design Mode popup. If you do something that you don’t remember how to undo, simply refresh the report. Any changes you made after your last saving will be lost. If you like the changes, then save changes.
- Any settings that is grayed out is a setting that can not be changed.
- Some settings will affect the report right away, you may have to move the popup to view the report.
- Some setting have no visual effects
Next lets get the graph bars to appear. In Design Mode do a search for AllowConditionalFormattingMenu place a checkmark to enable the setting. Close the popup and right click on the row/column you want to add the graph to show up. Conditional Formatting->Data Bars-> <select desired bar/color>. Save changes.
Filter/Search - Right click on the top to bring up a popup that shows “Show PreFilter”. In this popup you can set the search/filter. To remove the filter bring up the popup and remove all search criteria.
If you want to view how many items were sold in a date, just drag the Date button down to the “Drop Column Field Here”. Refreshing the report will reset the Date button (and search criteria). If you Save Changes, any time the report is ran, all the settings will be remembered (not the report Start and End date).
If you need to reset the report to default (beginning), select the option “Reset Layout” in the popup.
===============================================================
@adam100 (This is just an idea) since you have a grocery store/deli, you could create a Product Tag(s) that you could use sorta like a department/category & a sub-Department/Category. Something like this:
- Meats
- Beef
- Chicken
- Fish
- Dairy
- Milk
- Cheese
- Spreads
Etc.
Create Product Tags through: Main Menu->Manage->Setting->Program Settings->General Settings ->Product Tag Captions
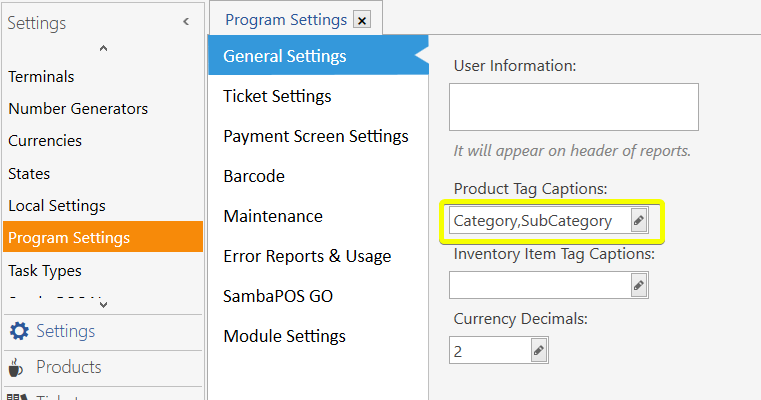
Edit the Product Tags through: Main Menu->Products->Product Tag Editor
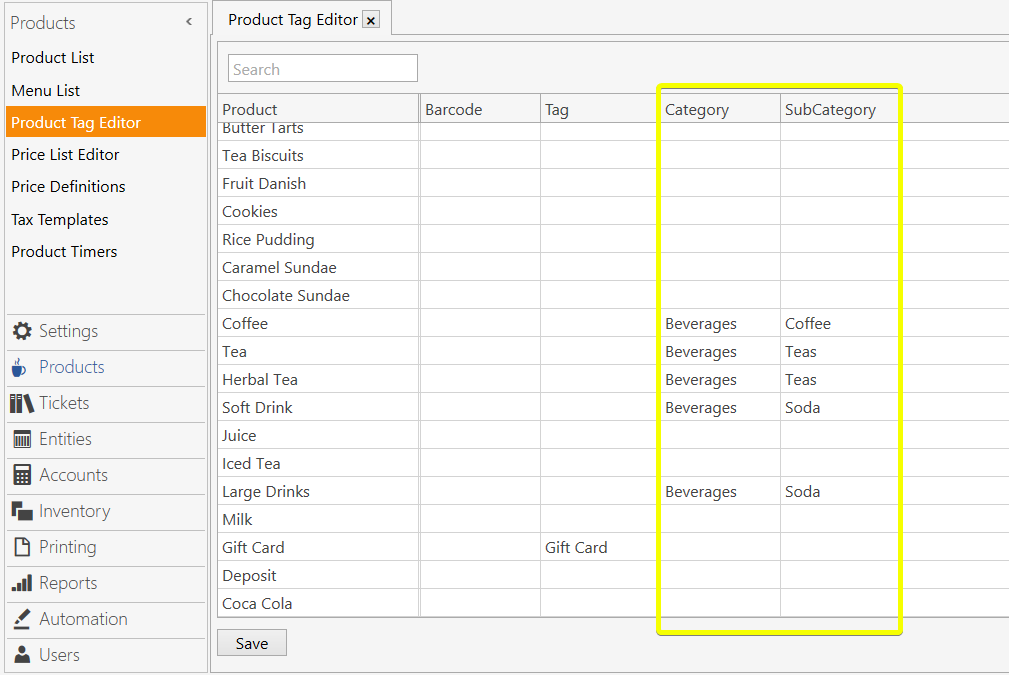
Here is an updated report using Category & SubCategory

Again, this is just an idea, necessary to do.
===============================================================
I strongly suggest to read through Knowledge Base post about pivot tables:
https://kb.sambapos.com/en/9-1-6-custom-report-pivot-table-views/